> ## Documentation Index
> Fetch the complete documentation index at: https://wb-21fd5541-feat-cli-docs-generator.mintlify.site/llms.txt
> Use this file to discover all available pages before exploring further.
# レポートを編集する
> App UI を使用してインタラクティブに、または W&B SDK を使用してプログラムで レポート を編集します。
レポートを App UI でインタラクティブに、または W\&B SDK を使ってプログラムで編集します。
Reports は *ブロック* で構成されます。ブロックはレポートの本体を構成します。これらのブロック内でテキスト、画像、組み込みの可視化、実験と run のプロット、パネルグリッドを追加できます。
*パネルグリッド* は、パネルと *run セット* を保持する特定の種類のブロックです。Run セットは W\&B のプロジェクトにログされる run のコレクションです。パネルは run セット データの可視化を行います。
[プログラム ワークスペースのチュートリアル](/ja/tutorials/workspaces) を参照して、保存済みワークスペースビューを作成およびカスタマイズするステップバイステップの例を見てみましょう。
プログラムでレポートを編集する場合は、W\&B Python SDK に加えて `wandb-workspaces` をインストールしてください:
pip install wandb wandb-workspaces
## プロットを追加する
各パネルグリッドには一連の run セットと一連のパネルがあります。このセクションの下部にある run セットで、グリッド内のパネルに表示されるデータを制御します。異なる run セットからデータを取得するチャートを追加する場合は、新しいパネルグリッドを作成してください。
レポートにスラッシュ(`/`)を入力して、ドロップダウンメニューを表示します。**Add panel** を選択してパネルを追加します。W\&B でサポートされている任意のパネルを追加できます。例えば、ラインプロット、散布図や並行座標チャートなどです。
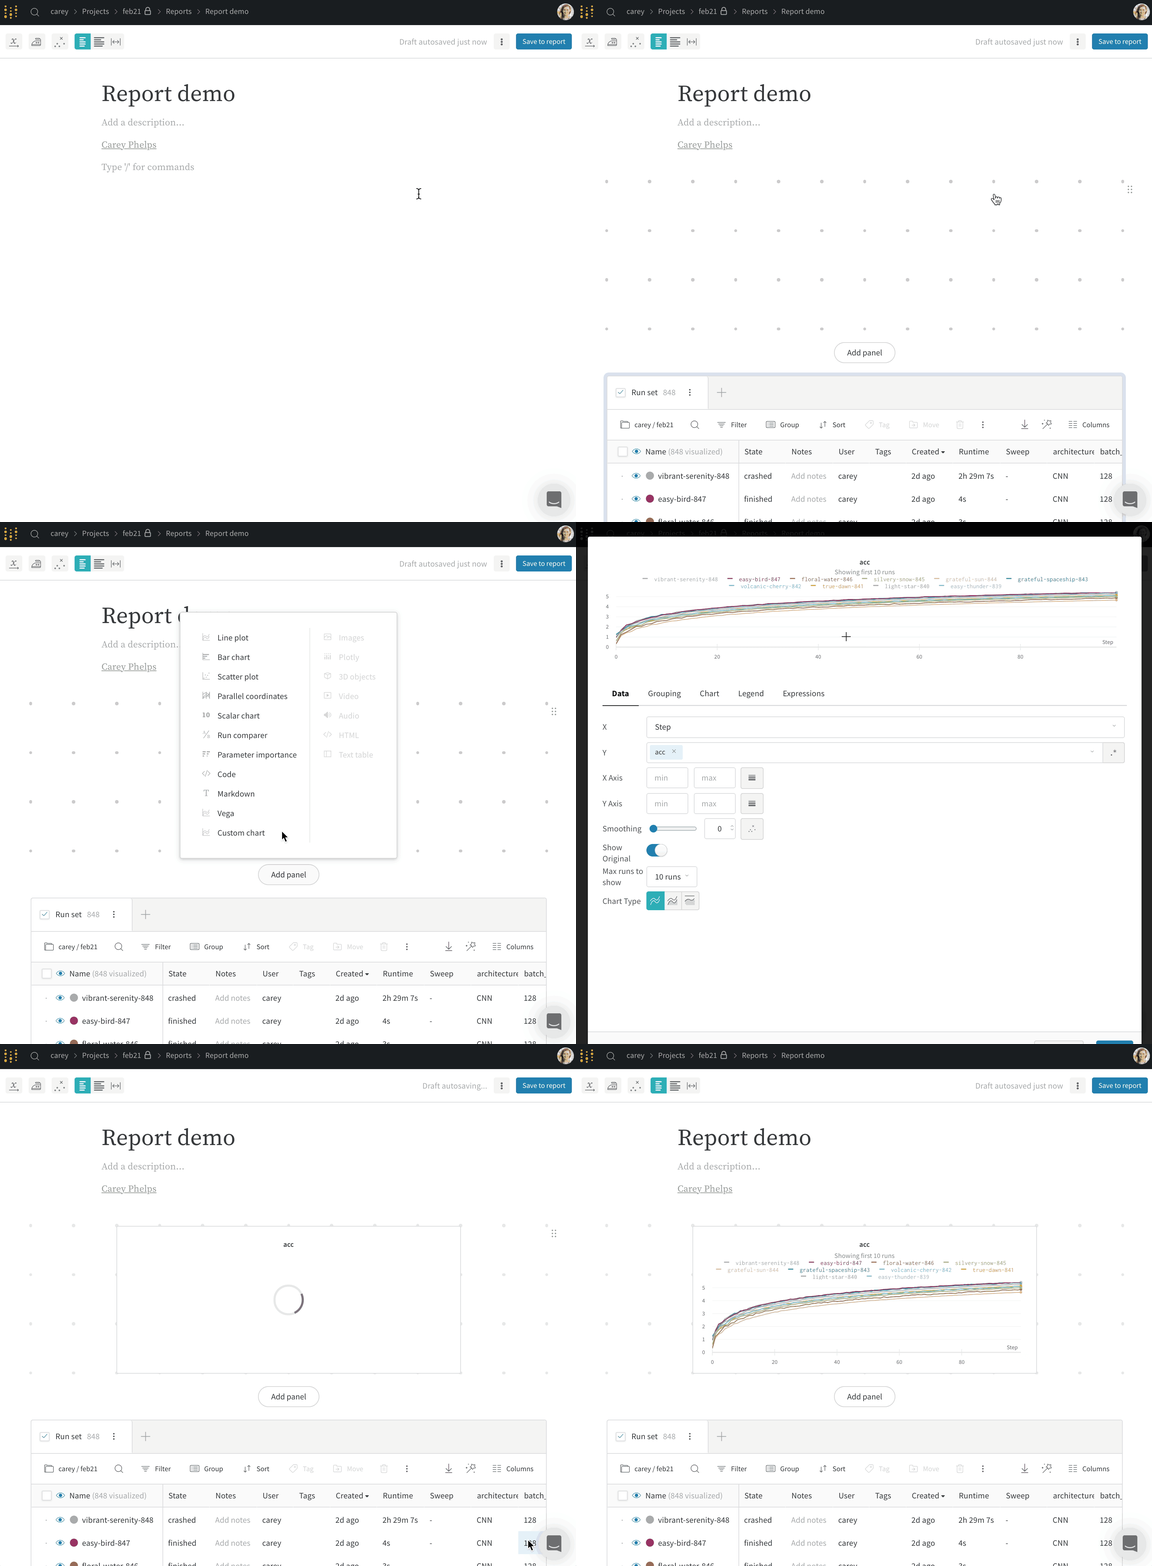 SDK を使用してプログラムでレポートにプロットを追加します。`PanelGrid` Public API クラスの `panels` パラメータに、1つ以上のプロットまたはチャートのオブジェクトのリストを渡します。対応する Python クラスを使用してプロットまたはチャートのオブジェクトを作成します。
以下の例では、ラインプロットと散布図の作成方法を示しています。
```python theme={null}
import wandb
import wandb_workspaces.reports.v2 as wr
report = wr.Report(
project="report-editing",
title="An amazing title",
description="A descriptive description.",
)
blocks = [
wr.PanelGrid(
panels=[
wr.LinePlot(x="time", y="velocity"),
wr.ScatterPlot(x="time", y="acceleration"),
]
)
]
report.blocks = blocks
report.save()
```
プログラムでレポートに追加できるプロットやチャートの詳細については、`wr.panels` を参照してください。
## Run セットを追加する
App UI または W\&B SDK を使用して、プロジェクトから run セットを追加します。
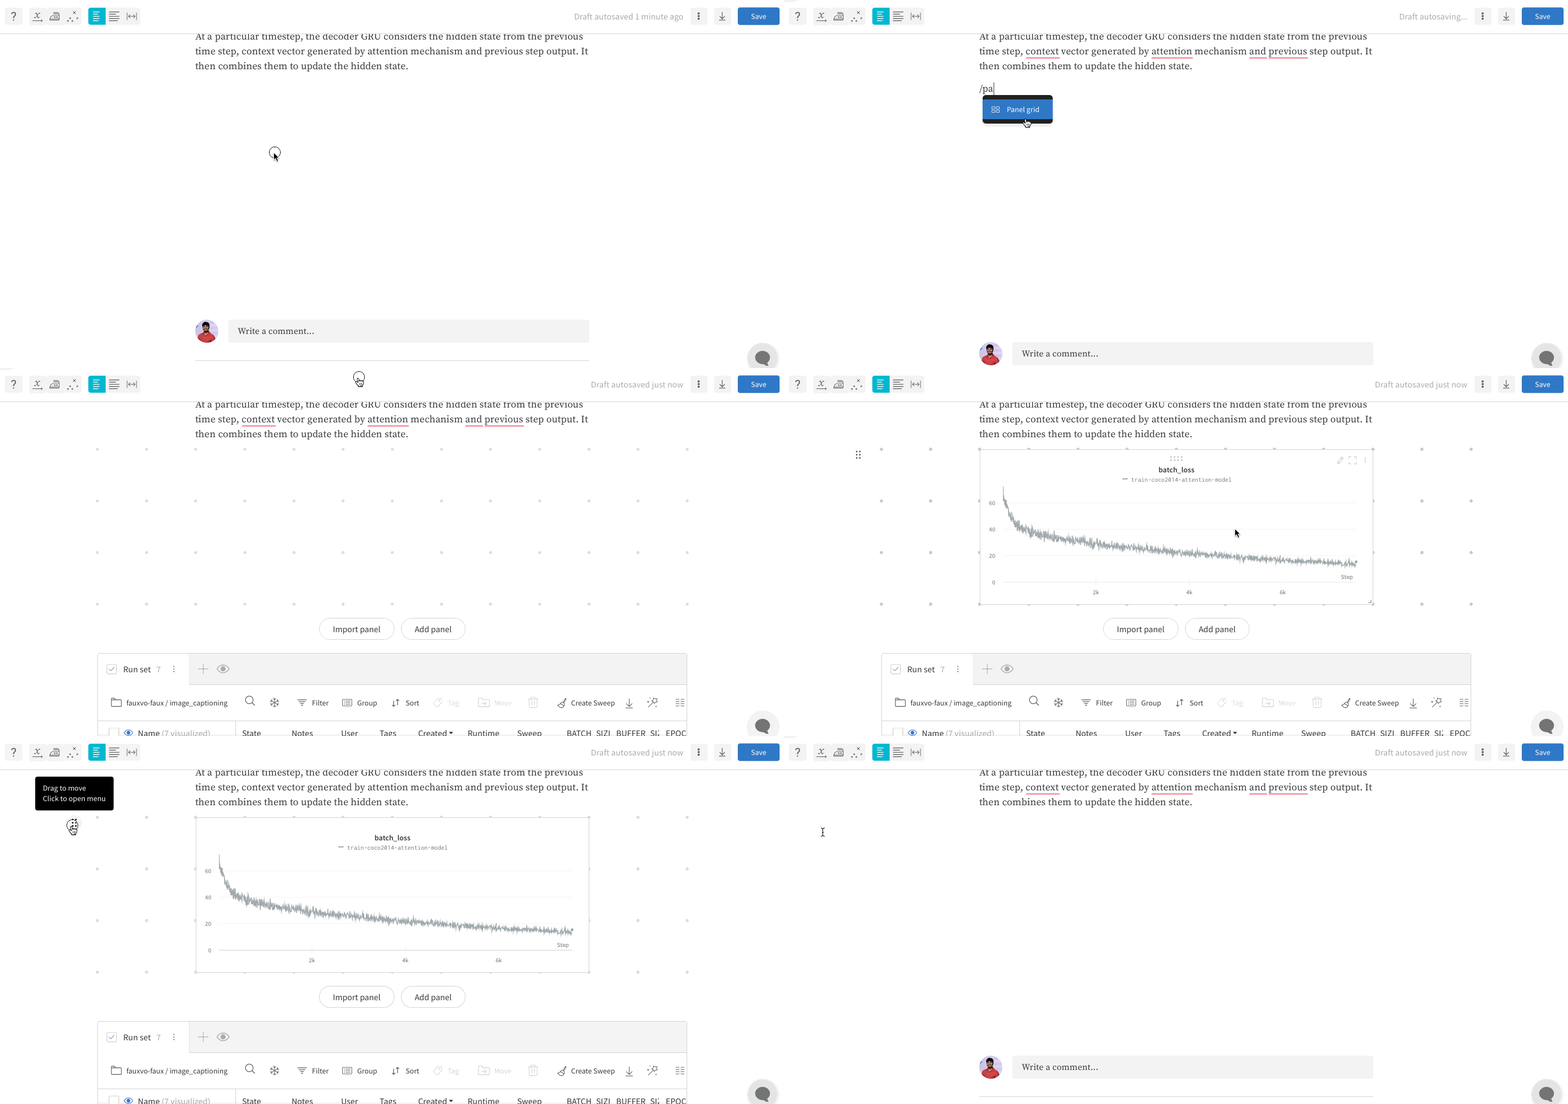
レポートにスラッシュ(`/`)を入力して、ドロップダウンメニューを表示します。ドロップダウンから Panel Grid を選択します。これにより、レポートが作成されたプロジェクトから自動的に run セットがインポートされます。
`wr.Runset()` および `wr.PanelGrid` クラスを使用してプロジェクトから run セットを追加します。以下の手順で run セットの追加方法を示します:
1. `wr.Runset()` オブジェクト インスタンスを作成します。プロジェクト パラメータのために、run セットを含むプロジェクトの名前を指定し、エンティティ パラメータのためにプロジェクトを所有するエンティティを指定します。
2. `wr.PanelGrid()` オブジェクト インスタンスを作成します。1つ以上の runset オブジェクトを `runsets` パラメータに渡します。
3. 1つ以上の `wr.PanelGrid()` オブジェクト インスタンスをリストに保存します。
4. パネルグリッド インスタンスのリストを使用して、レポート インスタンス ブロック属性を更新します。
```python theme={null}
import wandb
import wandb_workspaces.reports.v2 as wr
report = wr.Report(
project="report-editing",
title="An amazing title",
description="A descriptive description.",
)
panel_grids = wr.PanelGrid(
runsets=[wr.RunSet(project="", entity="")]
)
report.blocks = [panel_grids]
report.save()
```
ひとつの SDK 呼び出しで run セットとパネルを追加することもできます:
```python theme={null}
import wandb
report = wr.Report(
project="report-editing",
title="An amazing title",
description="A descriptive description.",
)
panel_grids = wr.PanelGrid(
panels=[
wr.LinePlot(
title="line title",
x="x",
y=["y"],
range_x=[0, 100],
range_y=[0, 100],
log_x=True,
log_y=True,
title_x="x axis title",
title_y="y axis title",
ignore_outliers=True,
groupby="hyperparam1",
groupby_aggfunc="mean",
groupby_rangefunc="minmax",
smoothing_factor=0.5,
smoothing_type="gaussian",
smoothing_show_original=True,
max_runs_to_show=10,
plot_type="stacked-area",
font_size="large",
legend_position="west",
),
wr.ScatterPlot(
title="scatter title",
x="y",
y="y",
# z='x',
range_x=[0, 0.0005],
range_y=[0, 0.0005],
# range_z=[0,1],
log_x=False,
log_y=False,
# log_z=True,
running_ymin=True,
running_ymean=True,
running_ymax=True,
font_size="small",
regression=True,
),
],
runsets=[wr.RunSet(project="", entity="")],
)
report.blocks = [panel_grids]
report.save()
```
## Run セットをフリーズする
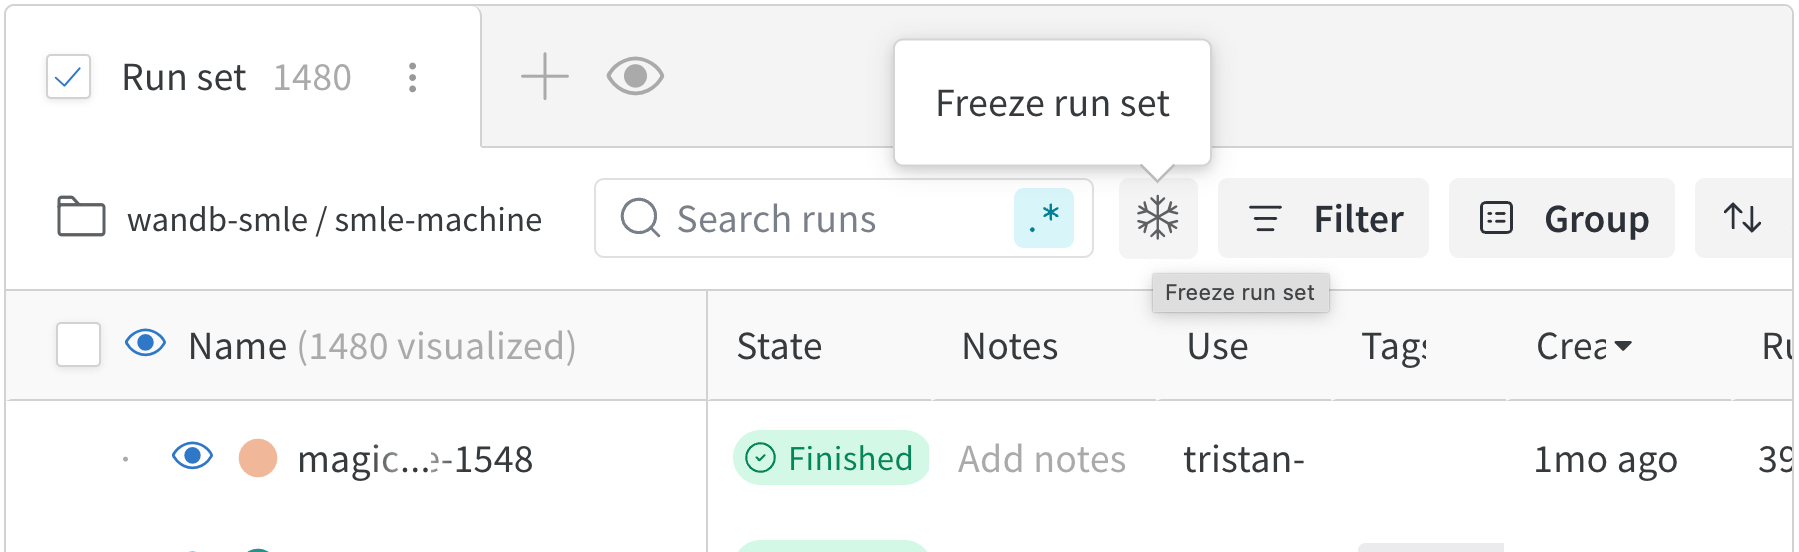
レポートはプロジェクトから最新のデータを表示するために run セットを自動的に更新します。しかし、レポート内の run セットを保持するには、その run セットを*フリーズ* することができます。Run セットをフリーズすると、特定の時点のレポート内の run セットの状態が保持されます。
レポートを表示する際に run セットをフリーズするには、**Filter** ボタンの近くにあるスノーフレーク アイコンをクリックします。
SDK を使用してプログラムでレポートにプロットを追加します。`PanelGrid` Public API クラスの `panels` パラメータに、1つ以上のプロットまたはチャートのオブジェクトのリストを渡します。対応する Python クラスを使用してプロットまたはチャートのオブジェクトを作成します。
以下の例では、ラインプロットと散布図の作成方法を示しています。
```python theme={null}
import wandb
import wandb_workspaces.reports.v2 as wr
report = wr.Report(
project="report-editing",
title="An amazing title",
description="A descriptive description.",
)
blocks = [
wr.PanelGrid(
panels=[
wr.LinePlot(x="time", y="velocity"),
wr.ScatterPlot(x="time", y="acceleration"),
]
)
]
report.blocks = blocks
report.save()
```
プログラムでレポートに追加できるプロットやチャートの詳細については、`wr.panels` を参照してください。
## Run セットを追加する
App UI または W\&B SDK を使用して、プロジェクトから run セットを追加します。
レポートにスラッシュ(`/`)を入力して、ドロップダウンメニューを表示します。ドロップダウンから Panel Grid を選択します。これにより、レポートが作成されたプロジェクトから自動的に run セットがインポートされます。
`wr.Runset()` および `wr.PanelGrid` クラスを使用してプロジェクトから run セットを追加します。以下の手順で run セットの追加方法を示します:
1. `wr.Runset()` オブジェクト インスタンスを作成します。プロジェクト パラメータのために、run セットを含むプロジェクトの名前を指定し、エンティティ パラメータのためにプロジェクトを所有するエンティティを指定します。
2. `wr.PanelGrid()` オブジェクト インスタンスを作成します。1つ以上の runset オブジェクトを `runsets` パラメータに渡します。
3. 1つ以上の `wr.PanelGrid()` オブジェクト インスタンスをリストに保存します。
4. パネルグリッド インスタンスのリストを使用して、レポート インスタンス ブロック属性を更新します。
```python theme={null}
import wandb
import wandb_workspaces.reports.v2 as wr
report = wr.Report(
project="report-editing",
title="An amazing title",
description="A descriptive description.",
)
panel_grids = wr.PanelGrid(
runsets=[wr.RunSet(project="", entity="")]
)
report.blocks = [panel_grids]
report.save()
```
ひとつの SDK 呼び出しで run セットとパネルを追加することもできます:
```python theme={null}
import wandb
report = wr.Report(
project="report-editing",
title="An amazing title",
description="A descriptive description.",
)
panel_grids = wr.PanelGrid(
panels=[
wr.LinePlot(
title="line title",
x="x",
y=["y"],
range_x=[0, 100],
range_y=[0, 100],
log_x=True,
log_y=True,
title_x="x axis title",
title_y="y axis title",
ignore_outliers=True,
groupby="hyperparam1",
groupby_aggfunc="mean",
groupby_rangefunc="minmax",
smoothing_factor=0.5,
smoothing_type="gaussian",
smoothing_show_original=True,
max_runs_to_show=10,
plot_type="stacked-area",
font_size="large",
legend_position="west",
),
wr.ScatterPlot(
title="scatter title",
x="y",
y="y",
# z='x',
range_x=[0, 0.0005],
range_y=[0, 0.0005],
# range_z=[0,1],
log_x=False,
log_y=False,
# log_z=True,
running_ymin=True,
running_ymean=True,
running_ymax=True,
font_size="small",
regression=True,
),
],
runsets=[wr.RunSet(project="", entity="")],
)
report.blocks = [panel_grids]
report.save()
```
## Run セットをフリーズする
レポートはプロジェクトから最新のデータを表示するために run セットを自動的に更新します。しかし、レポート内の run セットを保持するには、その run セットを*フリーズ* することができます。Run セットをフリーズすると、特定の時点のレポート内の run セットの状態が保持されます。
レポートを表示する際に run セットをフリーズするには、**Filter** ボタンの近くにあるスノーフレーク アイコンをクリックします。
 ## コード ブロックを追加する
レポートにコードブロックを App UI でインタラクティブに、または W\&B SDK で追加します。
レポートにスラッシュ(`/`)を入力して、ドロップダウン メニューを表示します。ドロップダウンから **Code** を選択します。
コード ブロックの右側にあるプログラミング言語の名前を選択すると、ドロップダウンが展開されます。利用可能なプログラミング言語の構文を選択してください。Javascript、Python、CSS、JSON、HTML、Markdown、YAML から選べます。
`wr.CodeBlock` クラスを使用してコード ブロックをプログラムで作成します。言語とコードにそれぞれ表示したい言語名とコードを指定します。
たとえば、以下の例では、YAML ファイルのリストを示しています。
```python theme={null}
import wandb
import wandb_workspaces.reports.v2 as wr
report = wr.Report(project="report-editing")
report.blocks = [
wr.CodeBlock(
code=["this:", "- is", "- a", "cool:", "- yaml", "- file"], language="yaml"
)
]
report.save()
```
これにより、次のようなコードブロックがレンダリングされます:
this:
* is
* a
cool:
* yaml
* file
以下の例では、Python コードブロックを示しています:
report = wr.Report(project="report-editing")
report.blocks = \[wr.CodeBlock(code=\["Hello, World!"], language="python")]
report.save()
これにより、次のようなコードブロックがレンダリングされます:
Hello, World!
## マークダウンを追加する
レポートにマークダウンを App UI でインタラクティブに、または W\&B SDK で追加します。
レポートにスラッシュ(`/`)を入力して、ドロップダウン メニューを表示します。ドロップダウンから **Markdown** を選択します。
`wandb.apis.reports.MarkdownBlock` クラスを使用して、プログラムでマークダウンブロックを作成します。`text` パラメータに文字列を渡します:
```python theme={null}
import wandb
import wandb_workspaces.reports.v2 as wr
report = wr.Report(project="report-editing")
report.blocks = [
wr.MarkdownBlock(text="Markdown cell with *italics* and **bold** and $e=mc^2$")
]
```
これにより、次のようなマークダウン ブロックがレンダリングされます:
## コード ブロックを追加する
レポートにコードブロックを App UI でインタラクティブに、または W\&B SDK で追加します。
レポートにスラッシュ(`/`)を入力して、ドロップダウン メニューを表示します。ドロップダウンから **Code** を選択します。
コード ブロックの右側にあるプログラミング言語の名前を選択すると、ドロップダウンが展開されます。利用可能なプログラミング言語の構文を選択してください。Javascript、Python、CSS、JSON、HTML、Markdown、YAML から選べます。
`wr.CodeBlock` クラスを使用してコード ブロックをプログラムで作成します。言語とコードにそれぞれ表示したい言語名とコードを指定します。
たとえば、以下の例では、YAML ファイルのリストを示しています。
```python theme={null}
import wandb
import wandb_workspaces.reports.v2 as wr
report = wr.Report(project="report-editing")
report.blocks = [
wr.CodeBlock(
code=["this:", "- is", "- a", "cool:", "- yaml", "- file"], language="yaml"
)
]
report.save()
```
これにより、次のようなコードブロックがレンダリングされます:
this:
* is
* a
cool:
* yaml
* file
以下の例では、Python コードブロックを示しています:
report = wr.Report(project="report-editing")
report.blocks = \[wr.CodeBlock(code=\["Hello, World!"], language="python")]
report.save()
これにより、次のようなコードブロックがレンダリングされます:
Hello, World!
## マークダウンを追加する
レポートにマークダウンを App UI でインタラクティブに、または W\&B SDK で追加します。
レポートにスラッシュ(`/`)を入力して、ドロップダウン メニューを表示します。ドロップダウンから **Markdown** を選択します。
`wandb.apis.reports.MarkdownBlock` クラスを使用して、プログラムでマークダウンブロックを作成します。`text` パラメータに文字列を渡します:
```python theme={null}
import wandb
import wandb_workspaces.reports.v2 as wr
report = wr.Report(project="report-editing")
report.blocks = [
wr.MarkdownBlock(text="Markdown cell with *italics* and **bold** and $e=mc^2$")
]
```
これにより、次のようなマークダウン ブロックがレンダリングされます:
 ## HTML要素を追加する
レポートに HTML 要素を App UI でインタラクティブに、または W\&B SDK で追加します。
レポートにスラッシュ(`/`)を入力して、ドロップダウン メニューを表示します。ドロップダウンからテキスト ブロックの種類を選択します。例として、H2 見出しブロックを作成するには、`Heading 2` のオプションを選択します。
1つ以上の HTML 要素のリストを `wandb.apis.reports.blocks` 属性に渡します。以下の例では、H1、H2、および無順リストを作成する方法を示しています:
```python theme={null}
import wandb
import wandb_workspaces.reports.v2 as wr
report = wr.Report(project="report-editing")
report.blocks = [
wr.H1(text="How Programmatic Reports work"),
wr.H2(text="Heading 2"),
wr.UnorderedList(items=["Bullet 1", "Bullet 2"]),
]
report.save()
```
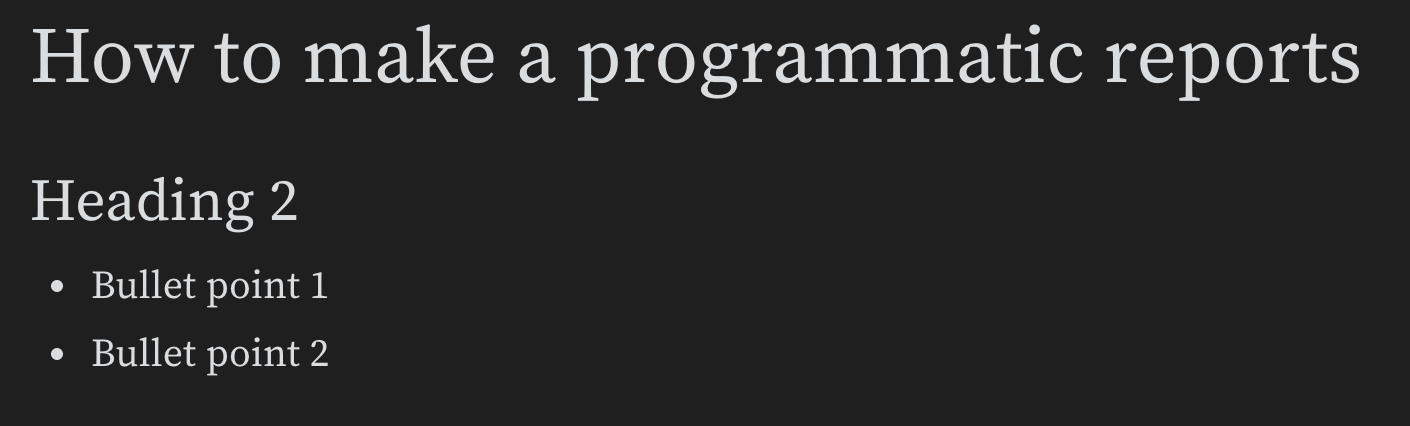
これにより、次のような HTML 要素がレンダリングされます:
## HTML要素を追加する
レポートに HTML 要素を App UI でインタラクティブに、または W\&B SDK で追加します。
レポートにスラッシュ(`/`)を入力して、ドロップダウン メニューを表示します。ドロップダウンからテキスト ブロックの種類を選択します。例として、H2 見出しブロックを作成するには、`Heading 2` のオプションを選択します。
1つ以上の HTML 要素のリストを `wandb.apis.reports.blocks` 属性に渡します。以下の例では、H1、H2、および無順リストを作成する方法を示しています:
```python theme={null}
import wandb
import wandb_workspaces.reports.v2 as wr
report = wr.Report(project="report-editing")
report.blocks = [
wr.H1(text="How Programmatic Reports work"),
wr.H2(text="Heading 2"),
wr.UnorderedList(items=["Bullet 1", "Bullet 2"]),
]
report.save()
```
これにより、次のような HTML 要素がレンダリングされます:
 ## リッチメディアリンクを埋め込む
レポート内にリッチメディアを App UI で、または W\&B SDK で埋め込みます。
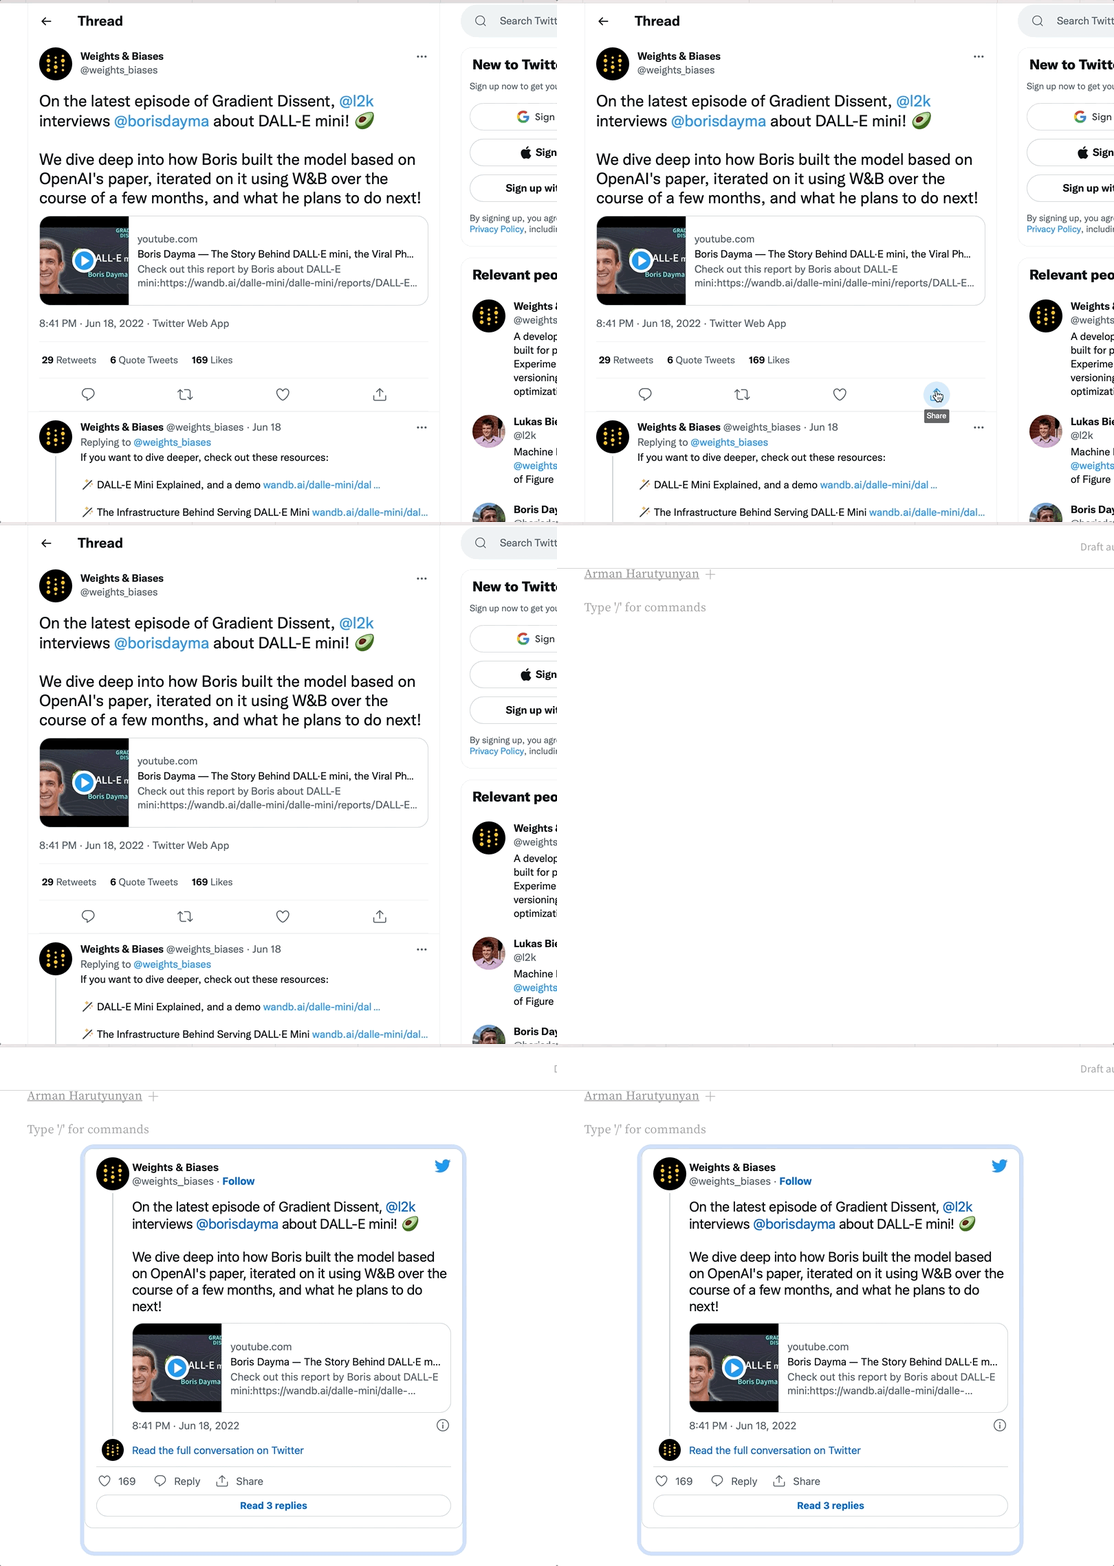
URL をレポートにコピーアンドペーストして、リッチメディアをレポート内に埋め込みます。以下のアニメーションは、Twitter、YouTube、および SoundCloud からの URL をコピーアンドペーストする方法を示しています。
### Twitter
レポートにツイートリンク URL をコピーして貼り付け、ツイートをレポート内に表示します。
## リッチメディアリンクを埋め込む
レポート内にリッチメディアを App UI で、または W\&B SDK で埋め込みます。
URL をレポートにコピーアンドペーストして、リッチメディアをレポート内に埋め込みます。以下のアニメーションは、Twitter、YouTube、および SoundCloud からの URL をコピーアンドペーストする方法を示しています。
### Twitter
レポートにツイートリンク URL をコピーして貼り付け、ツイートをレポート内に表示します。
 ### YouTube
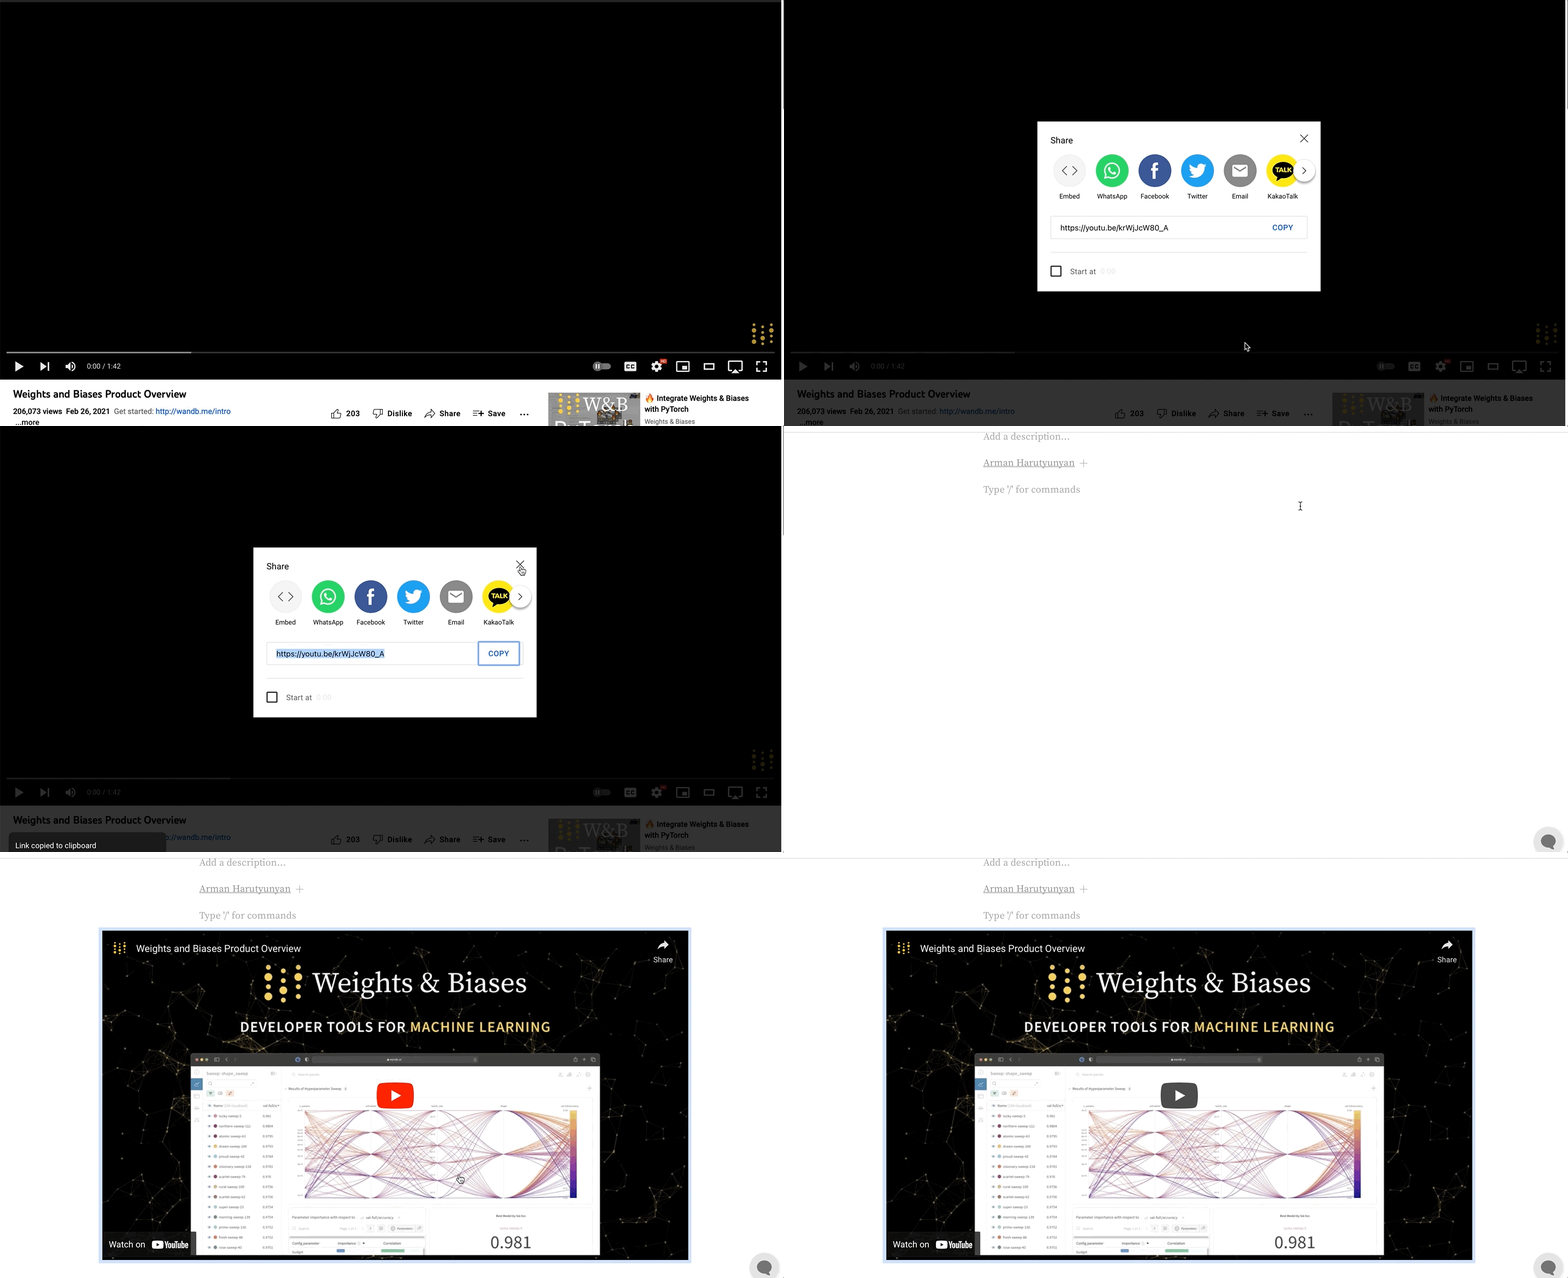
レポート内にビデオを埋め込むために YouTube ビデオ URL リンクをコピーアンドペーストします。
### YouTube
レポート内にビデオを埋め込むために YouTube ビデオ URL リンクをコピーアンドペーストします。
 ### SoundCloud
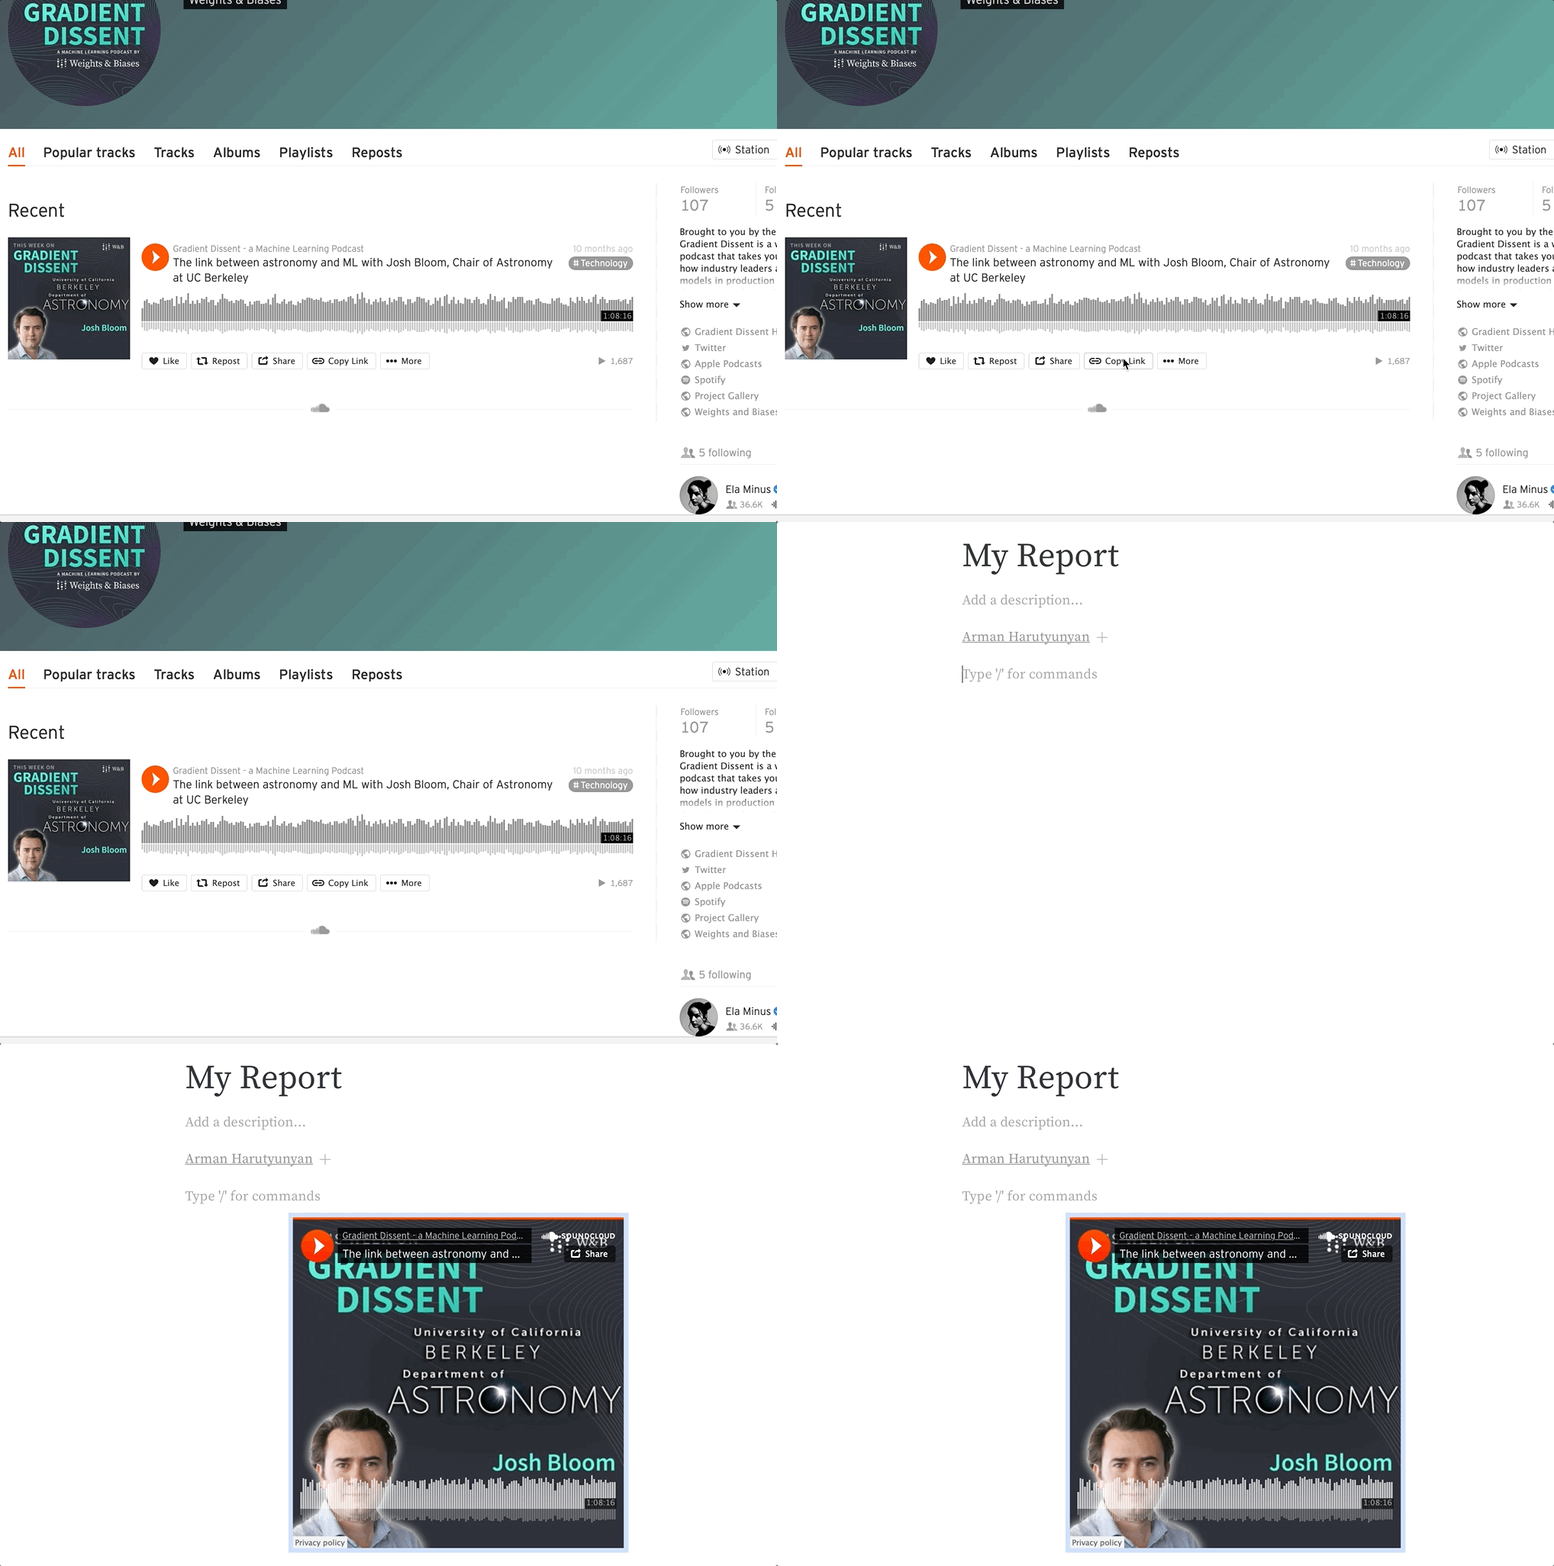
SoundCloud のリンクをコピーアンドペーストして、オーディオファイルをレポート内に埋め込みます。
### SoundCloud
SoundCloud のリンクをコピーアンドペーストして、オーディオファイルをレポート内に埋め込みます。
 1 つ以上の埋め込みメディア オブジェクトのリストを `wandb.apis.reports.blocks` 属性に渡します。以下の例では、ビデオと Twitter メディアをレポートに埋め込む方法を示しています:
```python theme={null}
import wandb
import wandb_workspaces.reports.v2 as wr
report = wr.Report(project="report-editing")
report.blocks = [
wr.Video(url="https://www.youtube.com/embed/6riDJMI-Y8U"),
wr.Twitter(
embed_html='\n'
),
]
report.save()
```
## パネルグリッドの複製と削除
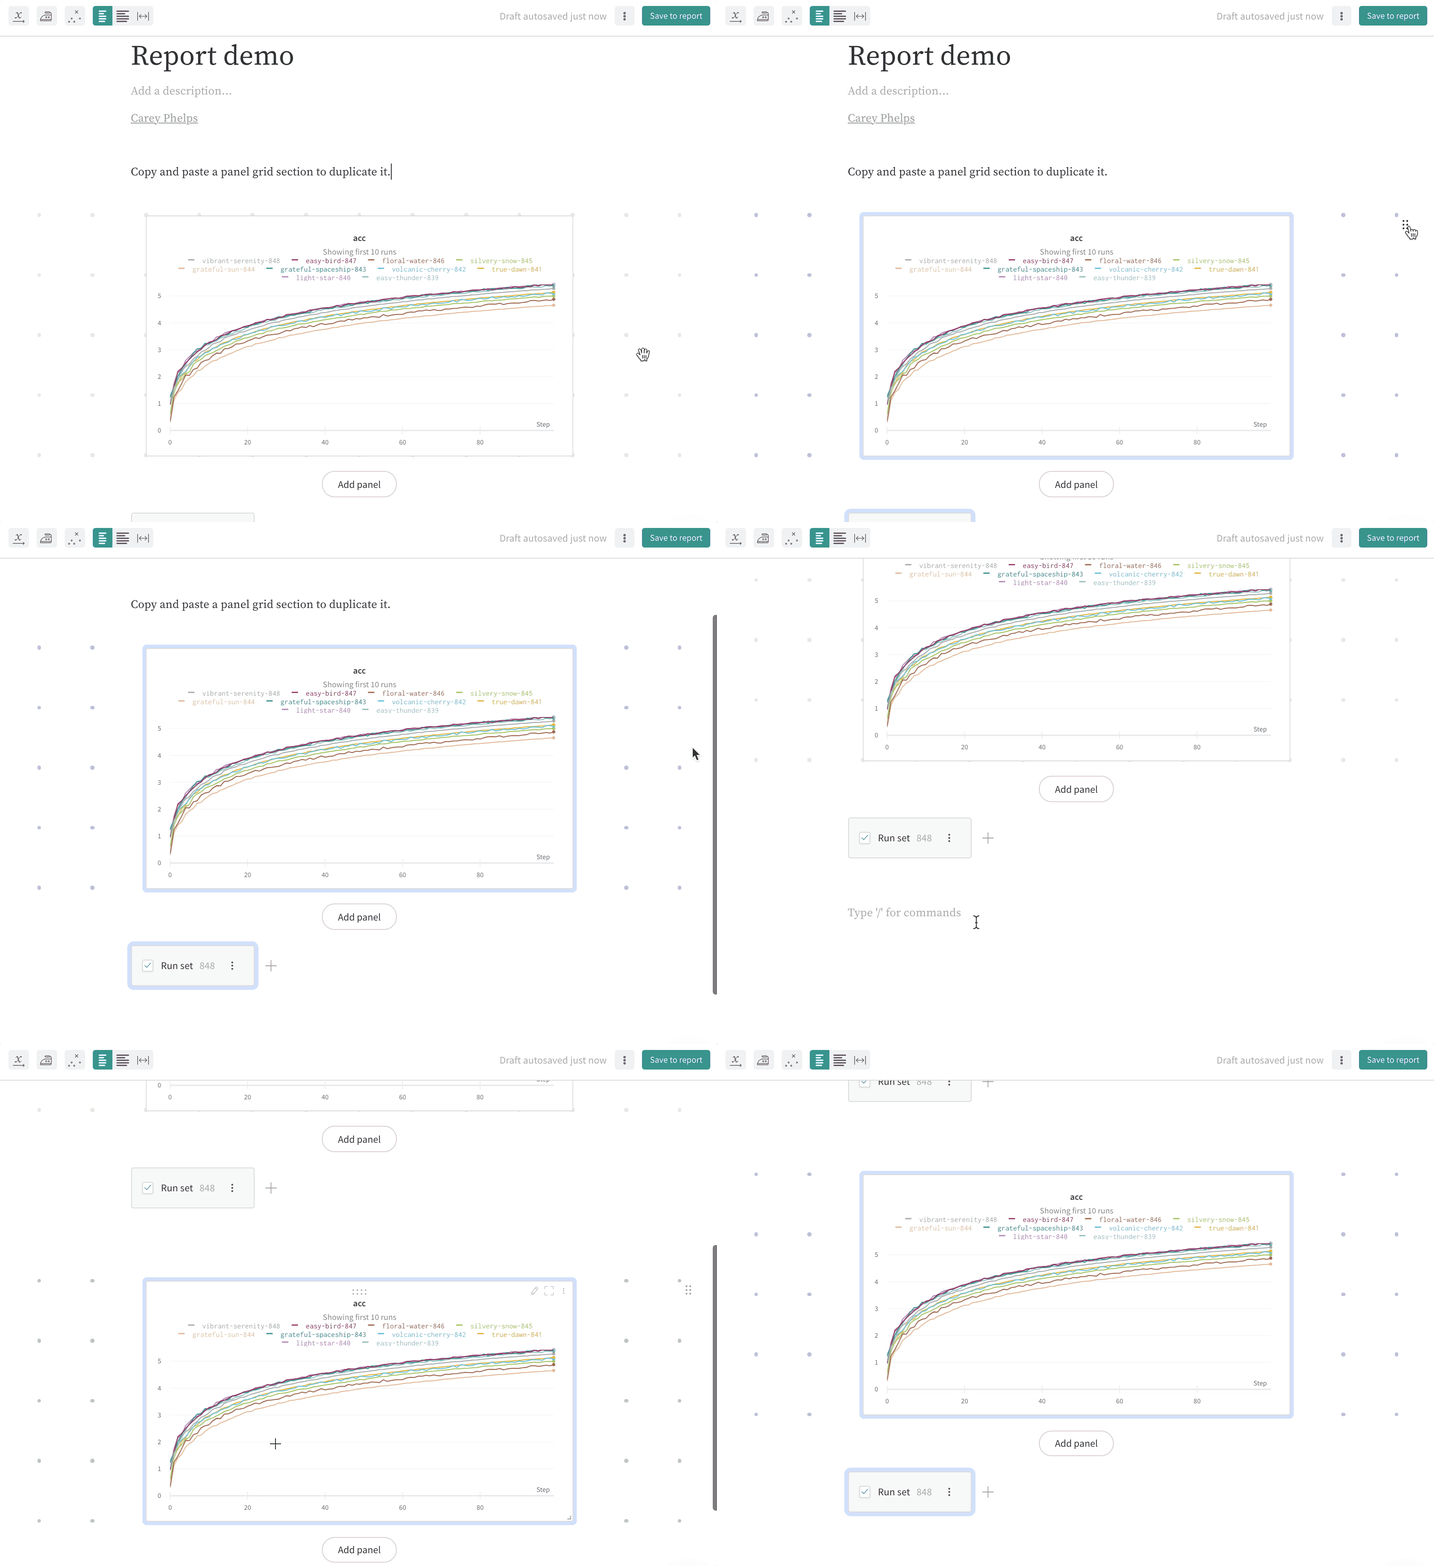
再利用したいレイアウトがある場合は、パネルグリッドを選択してコピー&ペーストすることで、同じレポート内に複製したり、別のレポートに貼り付けることができます。
パネルグリッドセクション全体を強調表示するには、右上隅のドラッグハンドルを選択します。パネルグリッド、テキスト、見出しなど、レポート内の領域をクリックしてドラッグして強調表示および選択します。
1 つ以上の埋め込みメディア オブジェクトのリストを `wandb.apis.reports.blocks` 属性に渡します。以下の例では、ビデオと Twitter メディアをレポートに埋め込む方法を示しています:
```python theme={null}
import wandb
import wandb_workspaces.reports.v2 as wr
report = wr.Report(project="report-editing")
report.blocks = [
wr.Video(url="https://www.youtube.com/embed/6riDJMI-Y8U"),
wr.Twitter(
embed_html='\n'
),
]
report.save()
```
## パネルグリッドの複製と削除
再利用したいレイアウトがある場合は、パネルグリッドを選択してコピー&ペーストすることで、同じレポート内に複製したり、別のレポートに貼り付けることができます。
パネルグリッドセクション全体を強調表示するには、右上隅のドラッグハンドルを選択します。パネルグリッド、テキスト、見出しなど、レポート内の領域をクリックしてドラッグして強調表示および選択します。
 パネルグリッドを選択し、キーボードで `delete` を押してパネルグリッドを削除します。
 ## レポート内のヘッダーを折りたたんで整理する
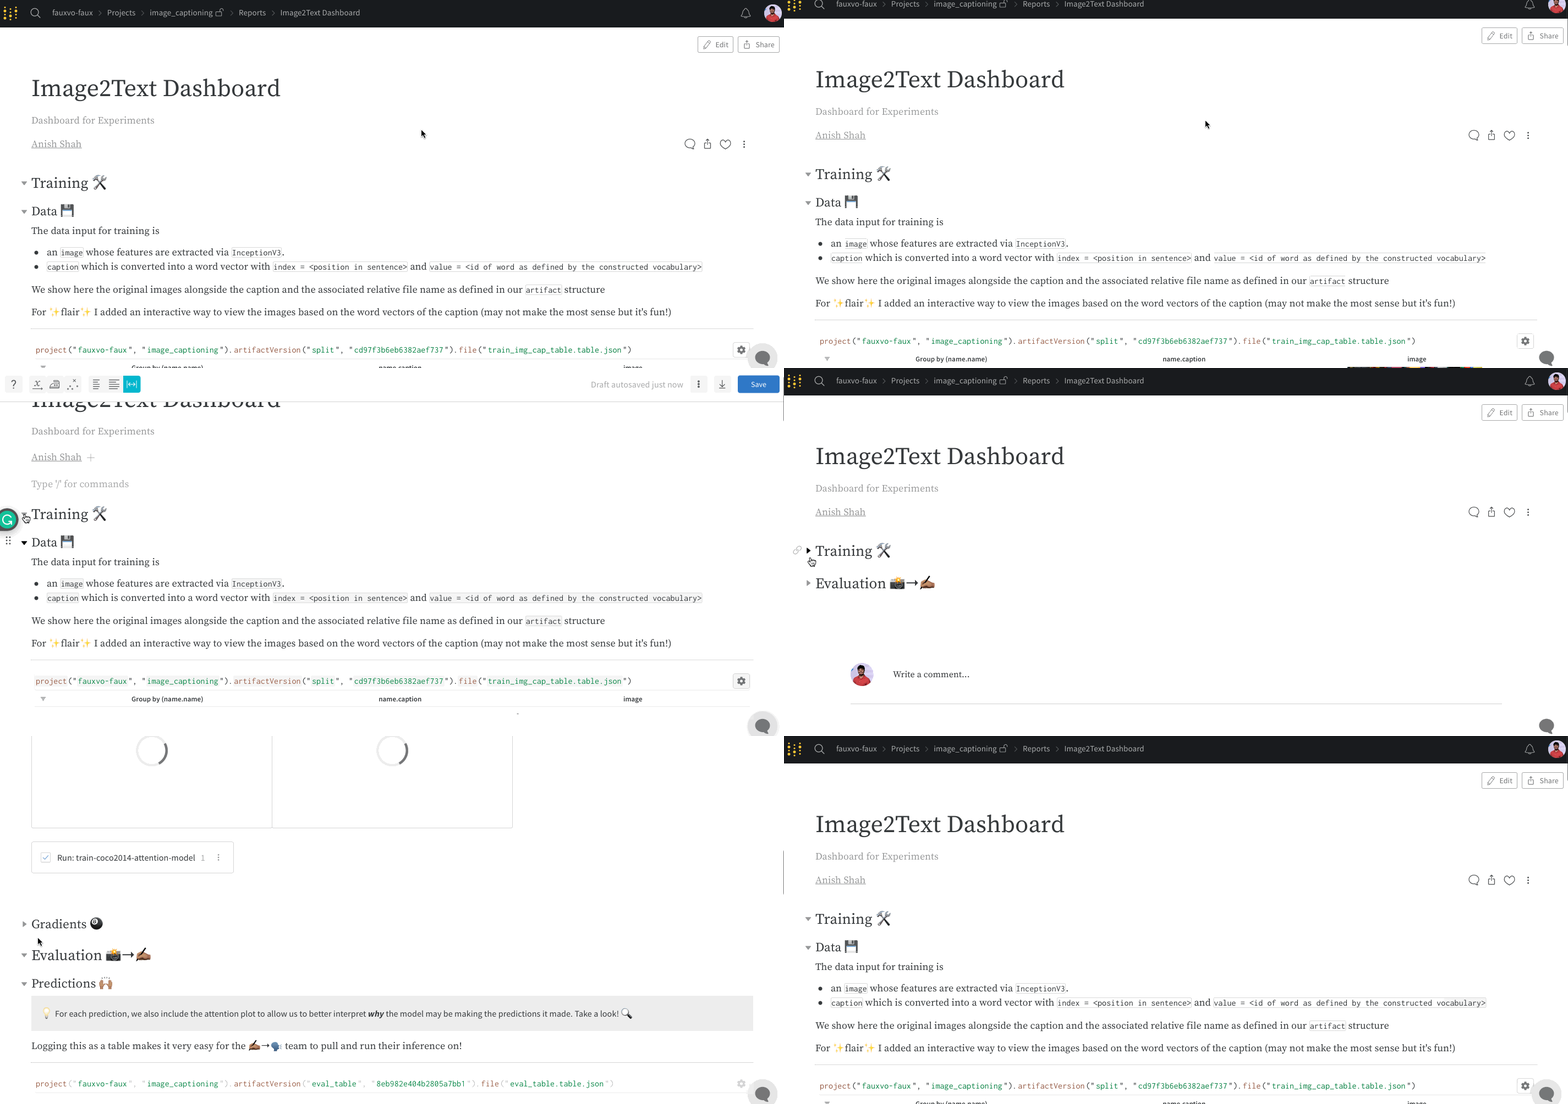
テキストブロック内のコンテンツを非表示にするために、レポート内のヘッダーを折りたたみます。レポートが読み込まれると、展開されているヘッダーのみがコンテンツを表示します。レポート内でヘッダーを折りたたむことで、コンテンツを整理し、過剰なデータの読み込みを防ぐことができます。以下の gif はその手順を示しています。
## レポート内のヘッダーを折りたたんで整理する
テキストブロック内のコンテンツを非表示にするために、レポート内のヘッダーを折りたたみます。レポートが読み込まれると、展開されているヘッダーのみがコンテンツを表示します。レポート内でヘッダーを折りたたむことで、コンテンツを整理し、過剰なデータの読み込みを防ぐことができます。以下の gif はその手順を示しています。
 ## 複数次元の関係を可視化する
複数次元の関係を効果的に可視化するために、変数の 1 つを示すためにカラーバリエーションを使用します。これにより明瞭さが向上し、パターンが解釈しやすくなります。
1. カラーグラデーションで表現する変数を選択します(例: 罰金スコア、学習率など)。これにより、罰金(色)がトレーニング時間 (x 軸) を経て報酬/副作用 (y 軸) とどのように相互作用するかをより明確に理解できます。
2. 主要なトレンドを強調します。特定の run グループにカーソルを合わせると、それが可視化で強調表示されます。
## 複数次元の関係を可視化する
複数次元の関係を効果的に可視化するために、変数の 1 つを示すためにカラーバリエーションを使用します。これにより明瞭さが向上し、パターンが解釈しやすくなります。
1. カラーグラデーションで表現する変数を選択します(例: 罰金スコア、学習率など)。これにより、罰金(色)がトレーニング時間 (x 軸) を経て報酬/副作用 (y 軸) とどのように相互作用するかをより明確に理解できます。
2. 主要なトレンドを強調します。特定の run グループにカーソルを合わせると、それが可視化で強調表示されます。