> ## Documentation Index
> Fetch the complete documentation index at: https://wb-21fd5541-feat-cli-docs-generator.mintlify.site/llms.txt
> Use this file to discover all available pages before exploring further.
# テーブル
> データセットを繰り返し、モデルの予測を理解する
W\&B Tables を使用して、表形式のデータを視覚化し、クエリを実行します。 例:
* 同じテストセットで異なるモデルがどのように機能するかを比較する
* データのパターンを特定する
* サンプルモデルの予測を視覚的に確認する
* よく誤分類される例を見つけるためにクエリを実行する
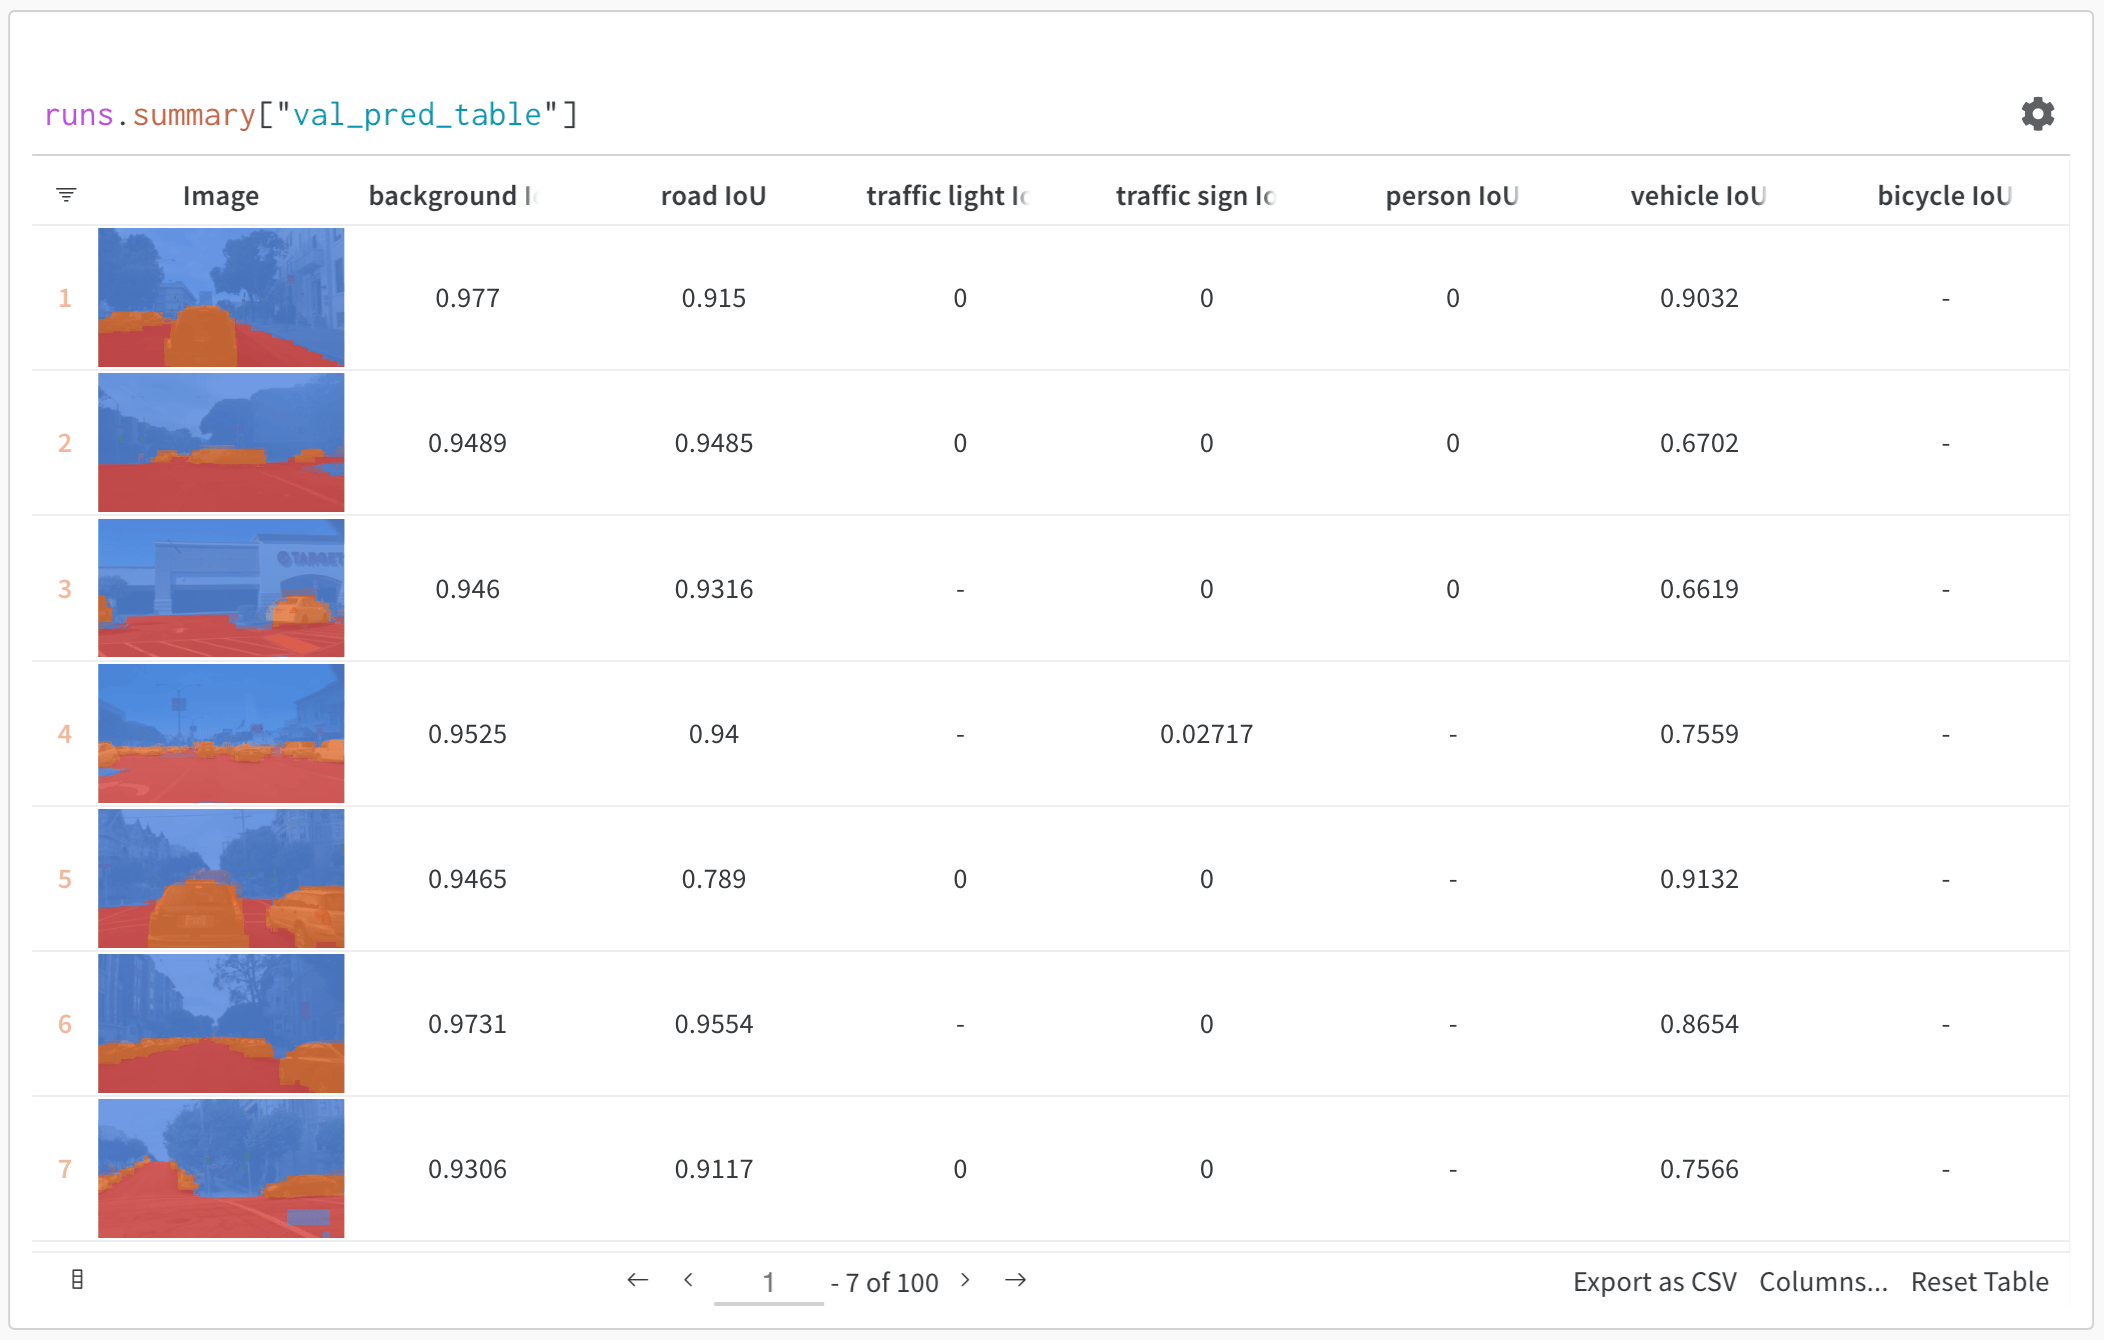 上の画像は、セマンティックセグメンテーションとカスタムメトリクスを含むテーブルを示しています。このテーブルはこちらの [W\&B ML Course のサンプルプロジェクト](https://wandb.ai/av-team/mlops-course-001) で見ることができます。
## 仕組み
Table は、各列が単一のデータ型を持つデータの 2 次元グリッドです。Tables はプリミティブ型と数値型、さらに入れ子リスト、辞書、およびリッチメディア型をサポートします。
## Table をログする
数行のコードでテーブルをログします:
* [`wandb.init()`](/ja/models/ref/python/init): [run](/ja/models/runs/) を作成して結果を追跡します。
* [`wandb.Table()`](/ja/models/ref/python/data-types/table): 新しいテーブルオブジェクトを作成します。
* `columns`: 列の名前を設定します。
* `data`: テーブルの内容を設定します。
* [`run.log()`](/ja/models/ref/python/log): テーブルをログして W\&B に保存します。
```python theme={null}
import wandb
run = wandb.init(project="table-test")
my_table = wandb.Table(columns=["a", "b"], data=[["a1", "b1"], ["a2", "b2"]])
run.log({"Table Name": my_table})
```
## 開始方法
* [クイックスタート](/ja/models/tables/tables-walkthrough/): データテーブルのログ、データの視覚化、データのクエリについて学びます。
* [Tables Gallery](/ja/models/tables/tables-gallery/): Tables のユースケース例を参照します。
上の画像は、セマンティックセグメンテーションとカスタムメトリクスを含むテーブルを示しています。このテーブルはこちらの [W\&B ML Course のサンプルプロジェクト](https://wandb.ai/av-team/mlops-course-001) で見ることができます。
## 仕組み
Table は、各列が単一のデータ型を持つデータの 2 次元グリッドです。Tables はプリミティブ型と数値型、さらに入れ子リスト、辞書、およびリッチメディア型をサポートします。
## Table をログする
数行のコードでテーブルをログします:
* [`wandb.init()`](/ja/models/ref/python/init): [run](/ja/models/runs/) を作成して結果を追跡します。
* [`wandb.Table()`](/ja/models/ref/python/data-types/table): 新しいテーブルオブジェクトを作成します。
* `columns`: 列の名前を設定します。
* `data`: テーブルの内容を設定します。
* [`run.log()`](/ja/models/ref/python/log): テーブルをログして W\&B に保存します。
```python theme={null}
import wandb
run = wandb.init(project="table-test")
my_table = wandb.Table(columns=["a", "b"], data=[["a1", "b1"], ["a2", "b2"]])
run.log({"Table Name": my_table})
```
## 開始方法
* [クイックスタート](/ja/models/tables/tables-walkthrough/): データテーブルのログ、データの視覚化、データのクエリについて学びます。
* [Tables Gallery](/ja/models/tables/tables-gallery/): Tables のユースケース例を参照します。