> ## Documentation Index
> Fetch the complete documentation index at: https://wb-21fd5541-feat-cli-docs-generator.mintlify.site/llms.txt
> Use this file to discover all available pages before exploring further.
> How to use the sidebar and table on the project page
# Filter and search runs
Use your project page to gain insights from runs logged to W\&B. You can filter and search runs from both the **Workspace** page and the **Runs** page.
## Filter runs
Filter runs based on their status, [tags](#filter-runs-with-tags), [regular expressions (RegEx)](#filter-runs-with-regular-expressions-regex) or other properties with the filter button.
See Customize run colors for more information on how to [edit, randomize, and reset run colors](/models/runs/run-colors/).
### Filter runs with tags
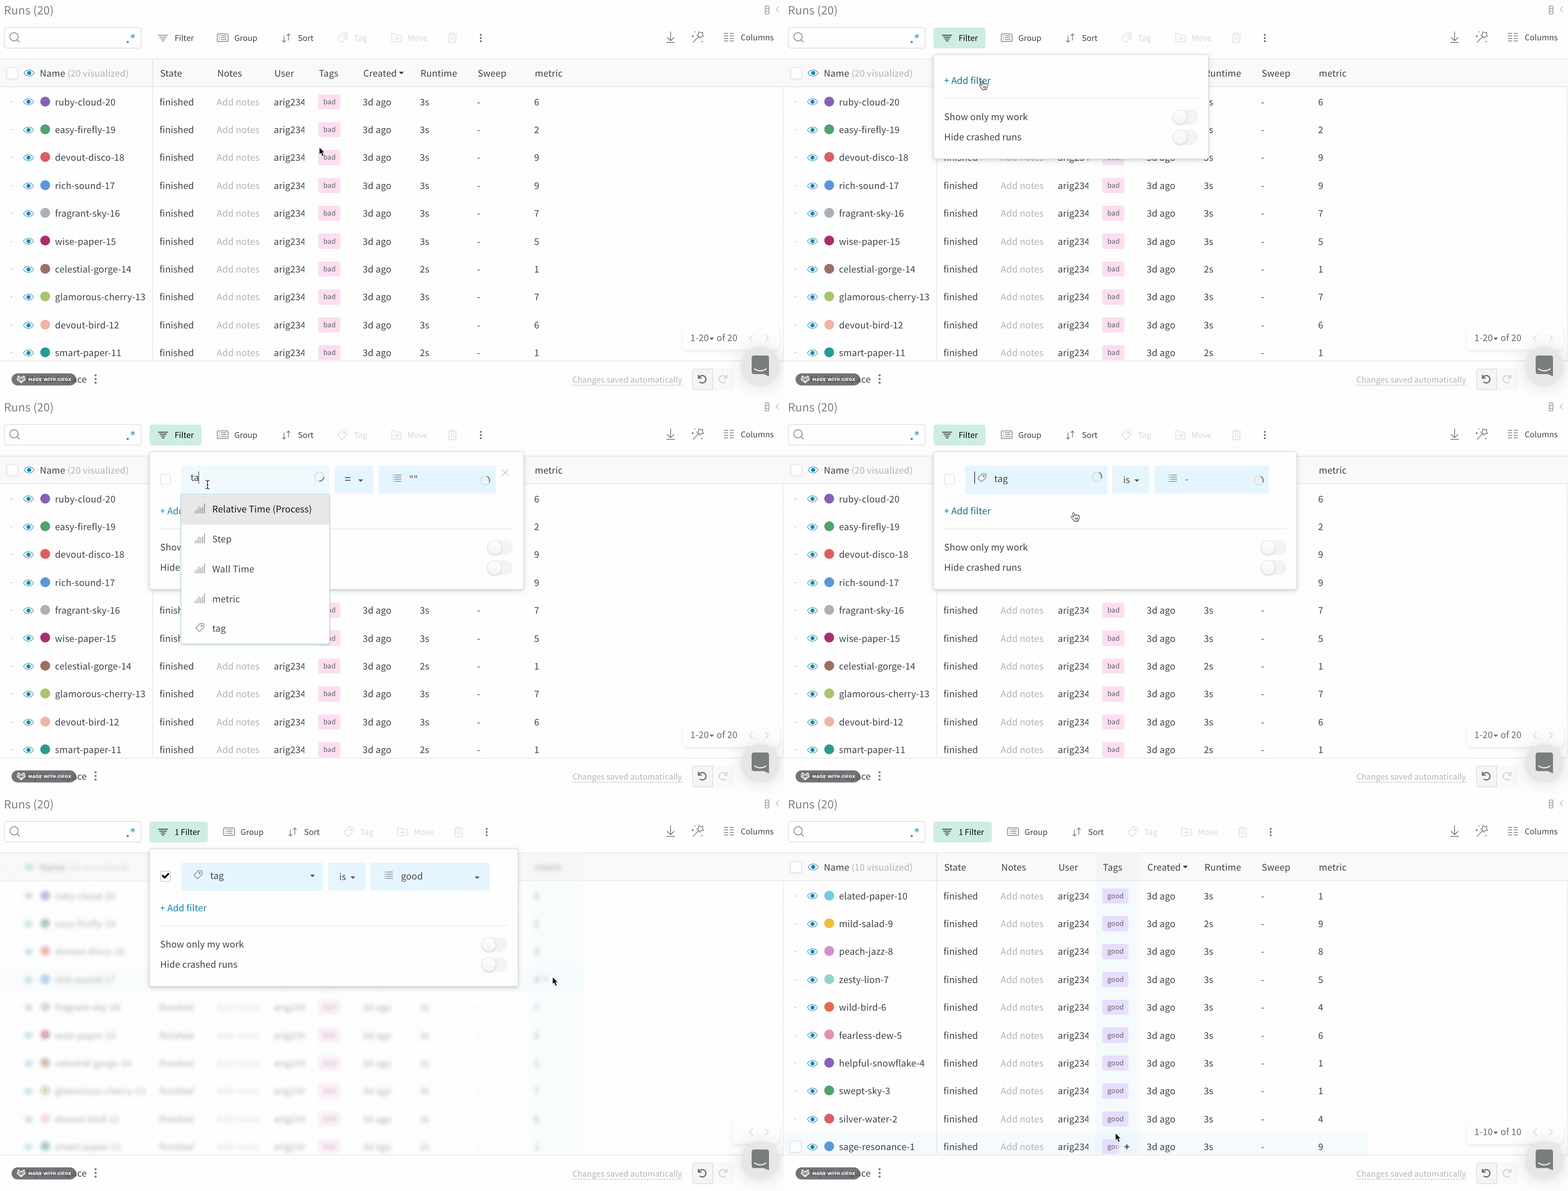
Filter runs based on their tags with the filter button.
1. Click on the **Runs** tab from the project sidebar.
2. Select the **Filter** button, which looks like a funnel, at the top of the runs table.
3. From left to right, select `"Tags"` from the dropdown menu, select a logic operator, and select a filter search value.
### Filter runs with regex
If regex doesn't provide you the desired results, you can make use of [tags](/models/runs/filter-runs/#filter-runs-with-tags) to filter out the runs in Runs Table. Tags can be added either on run creation or after they're finished. Once the tags are added to a run, you can add a tag filter as shown in the gif below.
 1. Click on the **Runs** tab from the project sidebar.
2. Click on the search box at the top of the runs table.
3. Ensure that the **RegEx** toggle (.\*) is enabled (the toggle should be blue).
4. Enter your regular expression in the search box.
## Search runs
Use regular expressions (RegEx) to find runs with the regular expression you specify. When you type a query in the search box, that will filter down the visible runs in the graphs on the workspace as well as filtering the rows of the table.
## Group runs
To group runs by one or more columns (including hidden columns):
1. Below the search box, click the **Group** button, which looks like a lined sheet of paper.
2. Select one or more columns to group results by.
3. Each set of grouped runs is collapsed by default. To expand it, click the arrow next to the group name.
## Sort runs by minimum and maximum values
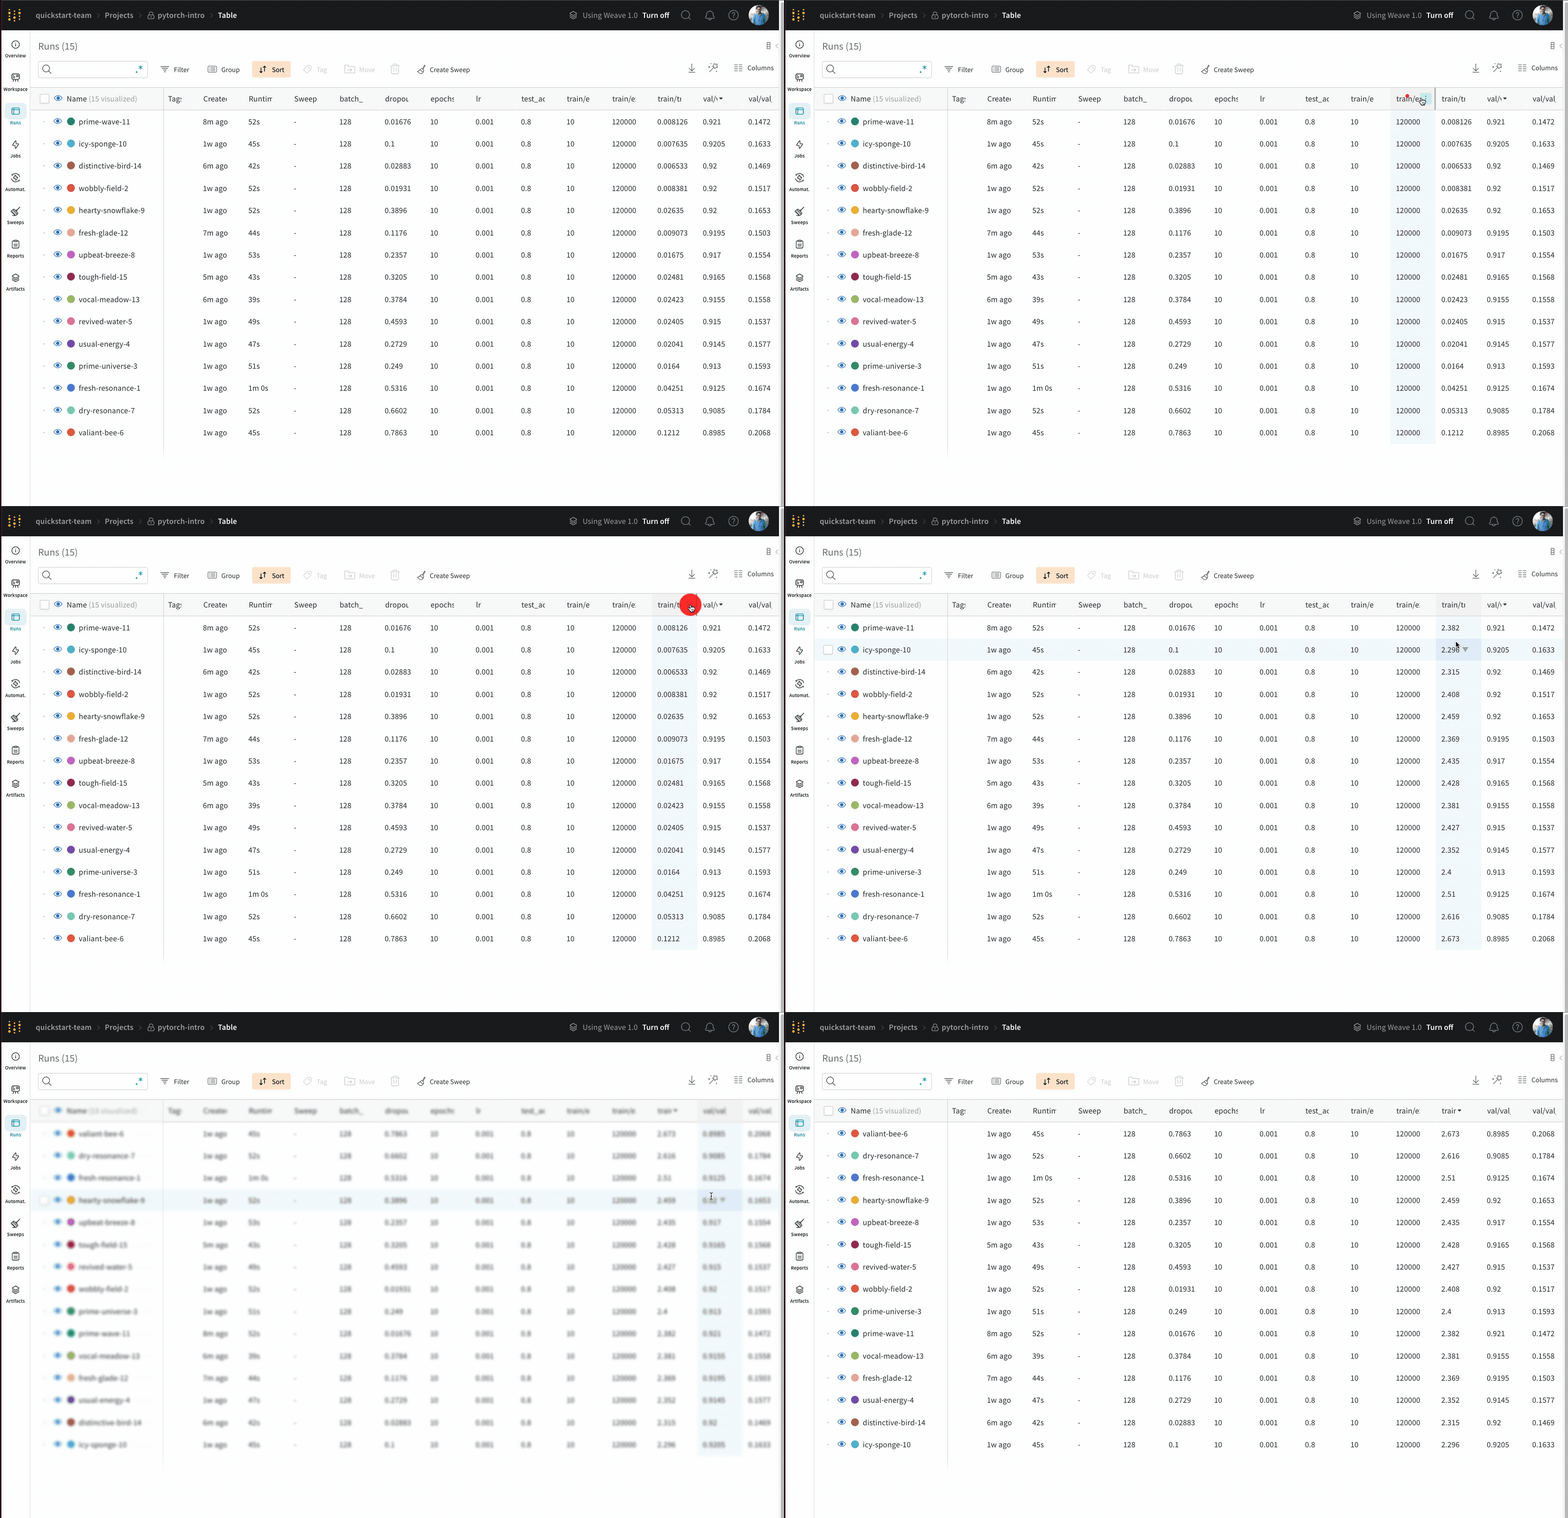
Sort the runs table by the minimum or maximum value of a logged metric. This is particularly useful if you want to view the best (or worst) recorded value.
The following steps describe how to sort the run table by a specific metric based on the minimum or maximum recorded value:
1. Hover your mouse over the column with the metric you want to sort with.
2. Select the kebab menu (three vertical lines).
3. From the dropdown, select either **Show min** or **Show max**.
4. From the same dropdown, select **Sort by asc** or **Sort by desc** to sort in ascending or descending order, respectively.
1. Click on the **Runs** tab from the project sidebar.
2. Click on the search box at the top of the runs table.
3. Ensure that the **RegEx** toggle (.\*) is enabled (the toggle should be blue).
4. Enter your regular expression in the search box.
## Search runs
Use regular expressions (RegEx) to find runs with the regular expression you specify. When you type a query in the search box, that will filter down the visible runs in the graphs on the workspace as well as filtering the rows of the table.
## Group runs
To group runs by one or more columns (including hidden columns):
1. Below the search box, click the **Group** button, which looks like a lined sheet of paper.
2. Select one or more columns to group results by.
3. Each set of grouped runs is collapsed by default. To expand it, click the arrow next to the group name.
## Sort runs by minimum and maximum values
Sort the runs table by the minimum or maximum value of a logged metric. This is particularly useful if you want to view the best (or worst) recorded value.
The following steps describe how to sort the run table by a specific metric based on the minimum or maximum recorded value:
1. Hover your mouse over the column with the metric you want to sort with.
2. Select the kebab menu (three vertical lines).
3. From the dropdown, select either **Show min** or **Show max**.
4. From the same dropdown, select **Sort by asc** or **Sort by desc** to sort in ascending or descending order, respectively.
 ## Search End Time for runs
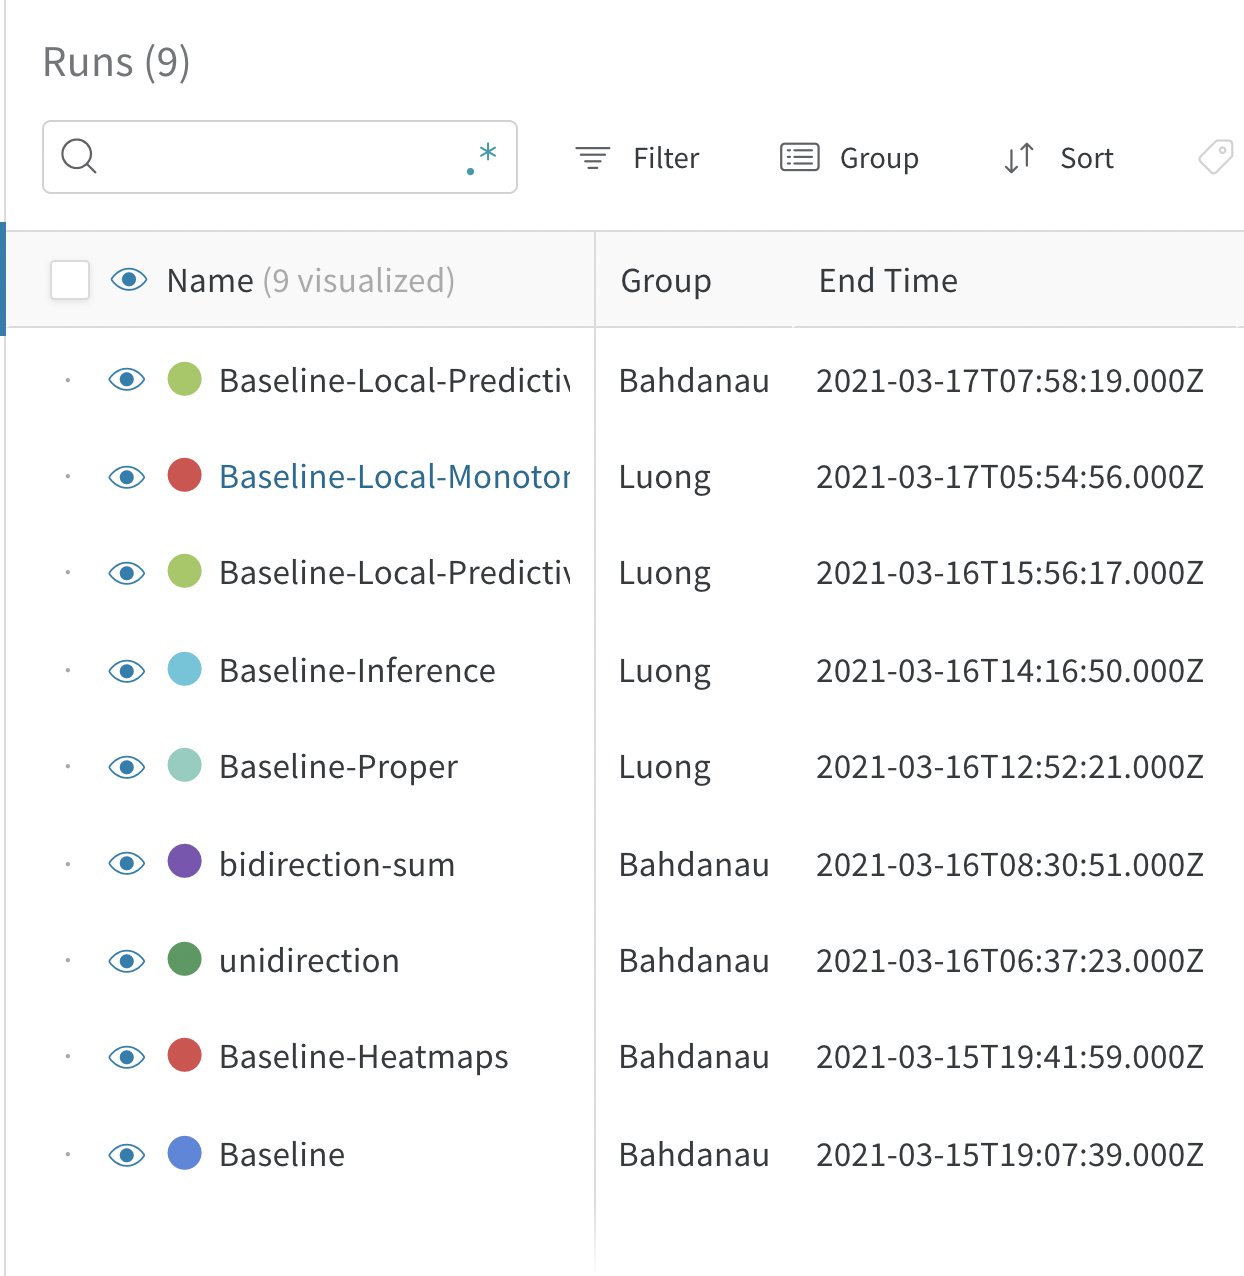
We provide a column named `End Time` that logs that last heartbeat from the client process. The field is hidden by default.
## Search End Time for runs
We provide a column named `End Time` that logs that last heartbeat from the client process. The field is hidden by default.
 ## Export runs table to CSV
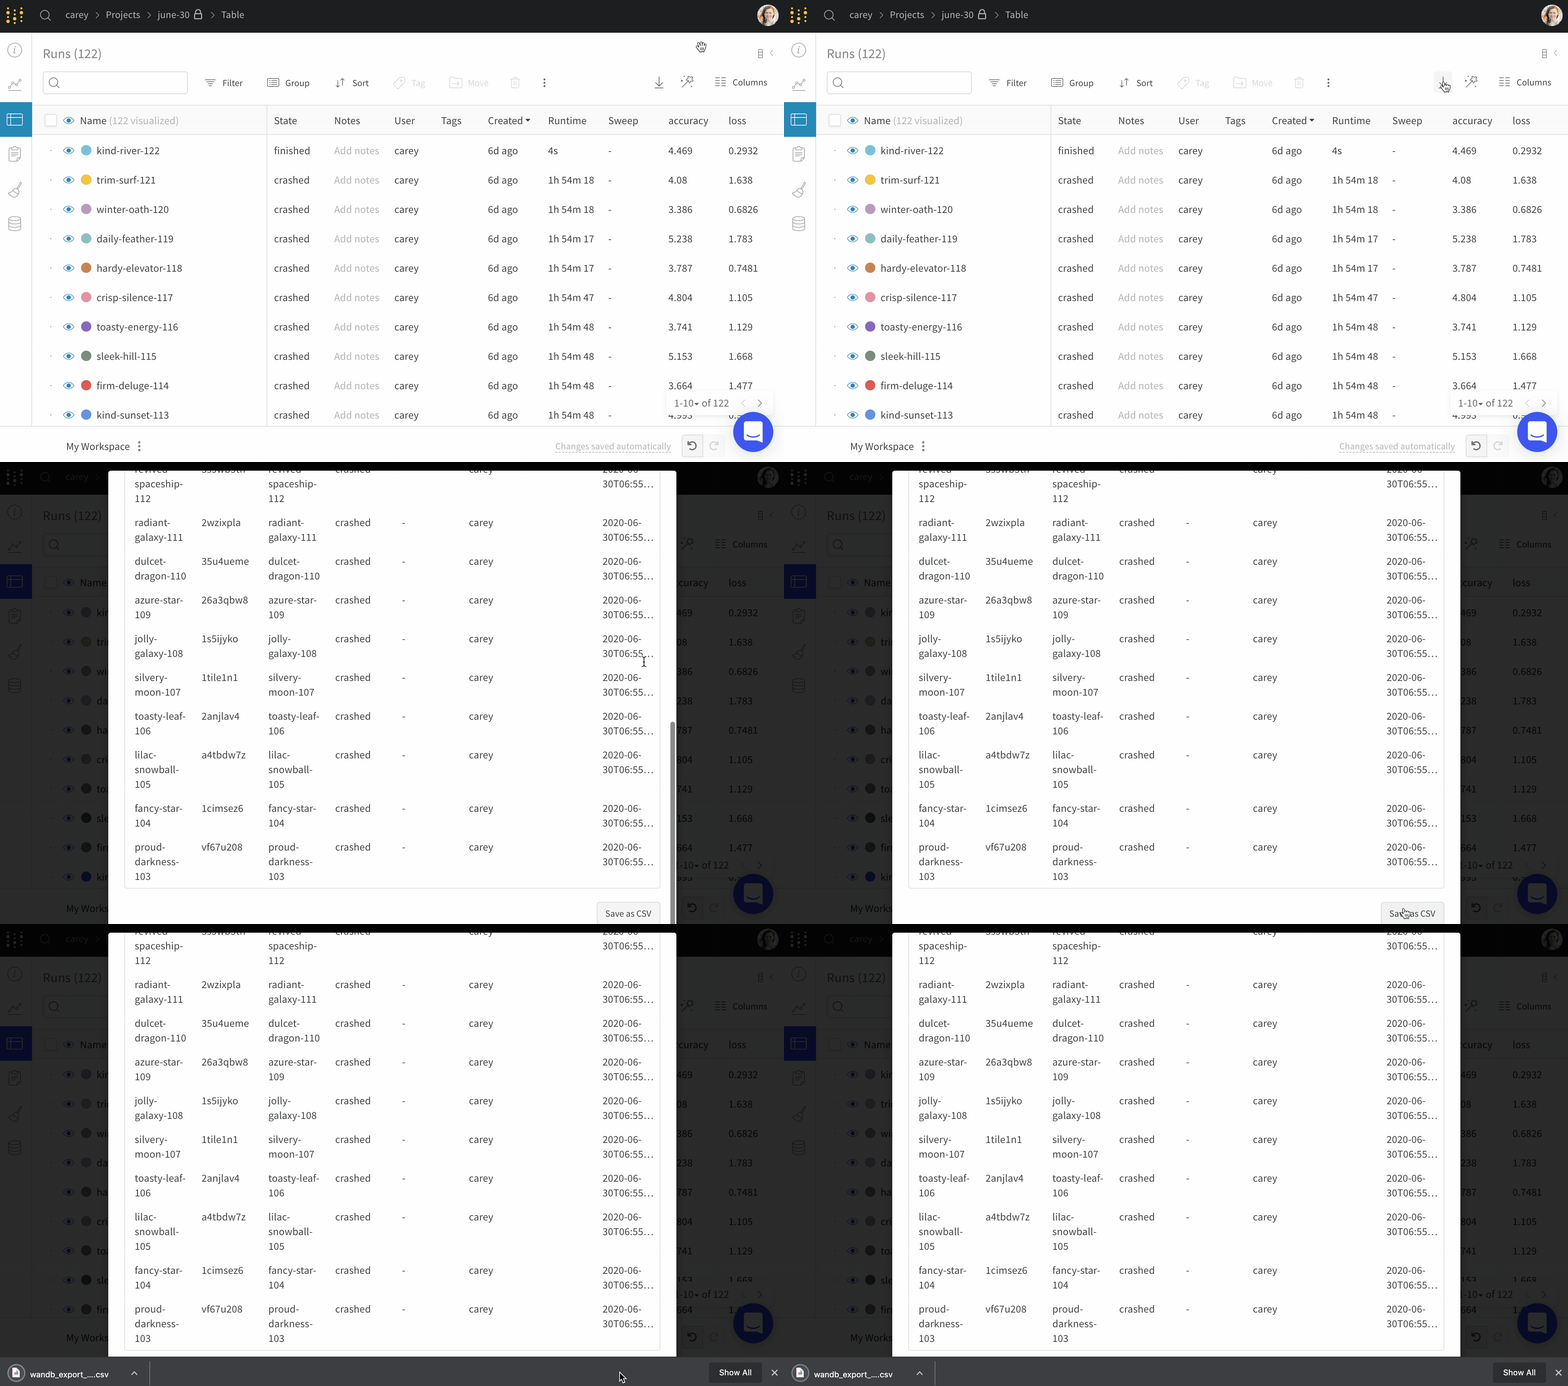
Export the table of all your runs, hyperparameters, and summary metrics to a CSV with the download button.
## Export runs table to CSV
Export the table of all your runs, hyperparameters, and summary metrics to a CSV with the download button.
 {/*
Look for a green dot next to the name of runs— this indicates they're active in the table and on the graph legends.
*/}
{/*
## Select all runs in table
Click the checkbox in the upper left corner of the table, and click "Select all runs" to select every run that matches the current set of filters.
{/*
Look for a green dot next to the name of runs— this indicates they're active in the table and on the graph legends.
*/}
{/*
## Select all runs in table
Click the checkbox in the upper left corner of the table, and click "Select all runs" to select every run that matches the current set of filters.
 */}
*/}