> ## Documentation Index
> Fetch the complete documentation index at: https://wb-21fd5541-feat-cli-docs-generator.mintlify.site/llms.txt
> Use this file to discover all available pages before exploring further.
> Group training and evaluation runs into larger experiments
# Group runs into experiments
Group individual jobs into experiments by passing a unique **group** name to **wandb.init()**.
## Use cases
1. **Distributed training:** Use grouping if your experiments are split up into different pieces with separate training and evaluation scripts that should be viewed as parts of a larger whole.
2. **Multiple processes**: Group multiple smaller processes together into an experiment.
3. **K-fold cross-validation**: Group together runs with different random seeds to see a larger experiment. Here's [an example](https://github.com/wandb/examples/tree/master/examples/wandb-sweeps/sweeps-cross-validation) of k-fold cross-validation with sweeps and grouping.
There are several ways to set grouping:
### 1. Set group in your script
Pass an optional group and `job_type` to `wandb.init()`. This gives you a dedicated group page for each experiment, which contains the individual runs. For example:`wandb.init(group="experiment_1", job_type="eval")`
### 2. Set a group environment variable
Use `WANDB_RUN_GROUP` to specify a group for your runs as an environment variable. For more on this, check our docs for [Environment Variables](/models/track/environment-variables/). **Group** should be unique within your project and shared by all runs in the group. You can use `wandb.util.generate_id()` to generate a unique 8 character string to use in all your processes— for example, `os.environ["WANDB_RUN_GROUP"] = "experiment-" + wandb.util.generate_id()`
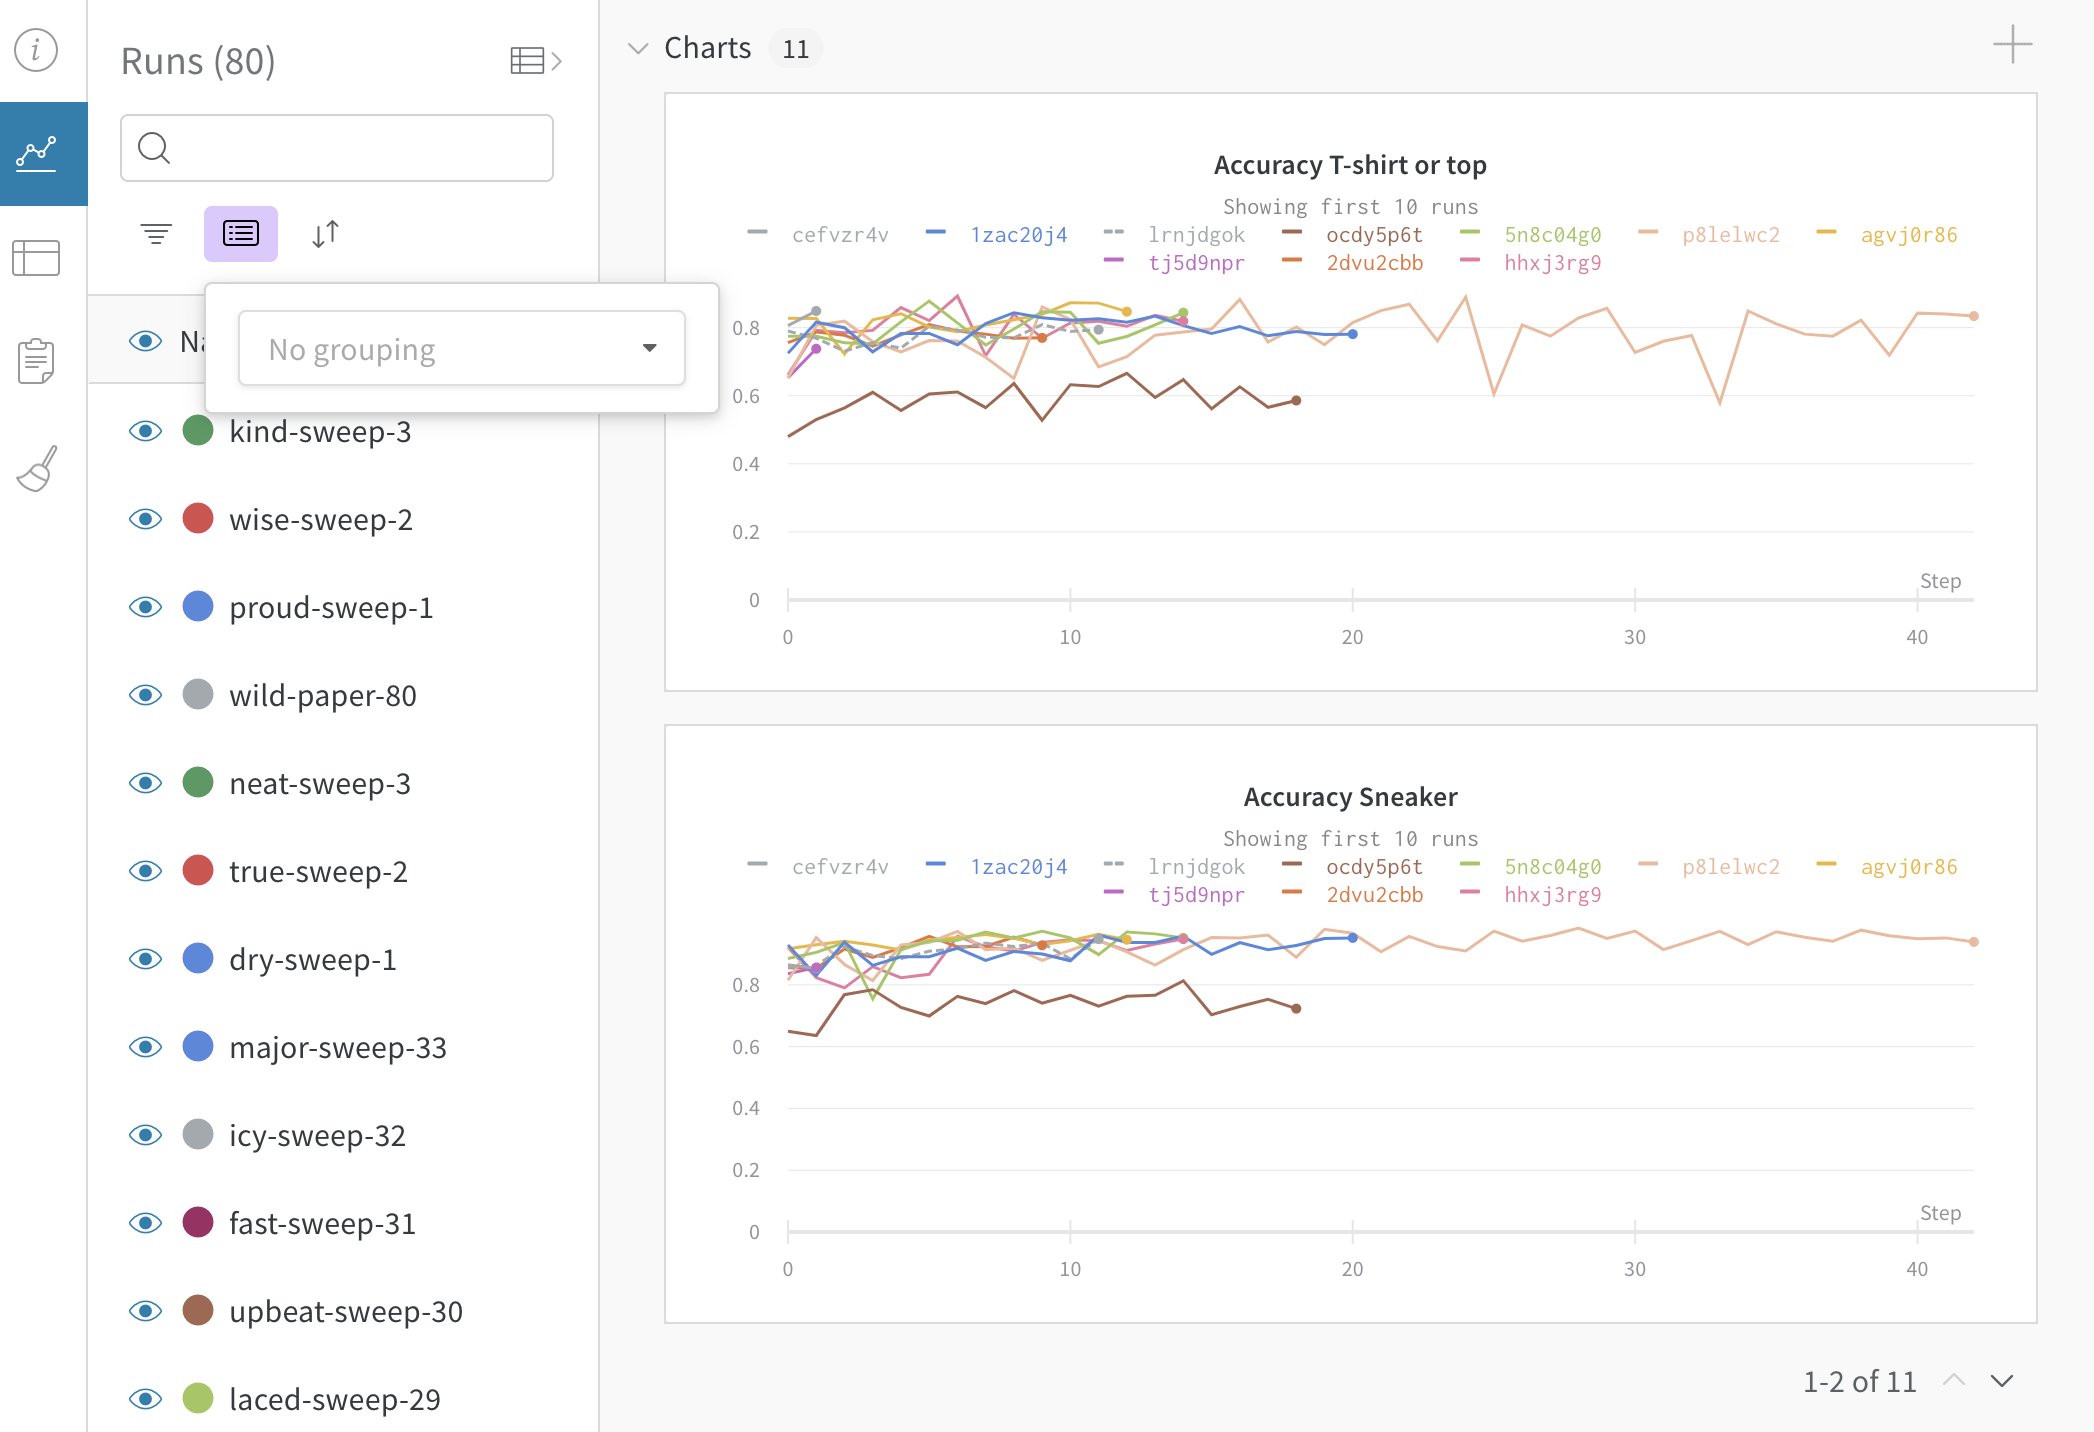
### 3. Toggle grouping by columns in the UI
You can dynamically group by any column, including a column that is hidden. For example, if you use `wandb.Run.config` to log batch size or learning rate, you can then group by those hyperparameters dynamically in the web app. The **Group by** feature is distinct from a [run's run group](/models/runs/grouping/). You can group runs by run group. To move a run to a different run group, refer to [Set a group in the UI](#set-a-group-in-the-ui).
In the list of runs, the **Group** column is hidden by default.
To group runs by one or more columns:
1. Click **Group**.
2. Click the names of one or more columns.
3. If you selected more than one column, drag them to change the grouping order.
4. Click anywhere outside of the form to dismiss it.
### 4. Manage groups in the UI
#### Manage a run
After a run is initialized, you can move it to a new group from your workspace or its **Runs** page.
1. Navigate to your W\&B project.
2. Select the **Workspace** or **Runs** tab from the project sidebar.
3. To move a single run, search or scroll to it. Hover over the run name, click the three vertical dots, then click **Move to another group**.
4. To create a new group, click **New group**. Type a group name, then submit the form.
5. To delete a run, click the three vertical dots, then click **Delete run**.
6. To move a run, select the new group from the list, then click **Move**.
#### Manage runs in bulk
This section shows how to manage multiple runs at once, across one or more run groups.
1. If necessary, [toggle grouping by columns](#toggle-grouping-by-column-in-the-ui), grouping by the **Group** column.
2. Expand a group to view its runs. In a single bulk operation, you can move runs from different groups to the same target group. Expand all relevant groups.
3. To select all runs in a group, click the checkbox next to the group name.
4. To select individual runs, click their checkboxes.
5. To select all runs in all groups, click the checkbox next to the **Name** column heading.
6. Above the table, choose a bulk operation: **Tag**, **Move to group**, **Move to project**, or **New sweep**.
#### Create a group
To create a new run group:
1. Navigate to your W\&B project.
2. Select the **Workspace** or **Runs** tab from the project sidebar.
3. Click **New group**. Type a group name, then submit the form.
#### Delete a group
To delete a group, remove all runs from it. This automatically deletes the group.
### Customize how runs are displayed
You can customize how runs are displayed in your project from the **Workspace** or **Runs** tabs. Both tabs use the same display configuration.
To customize which columns are visible:
1. Above the list of runs, click **Columns**.
2. Click the name of a hidden column to show it. Click the name of a visible column to hide it.
You can optionally search by column name using fuzzy search, an exact match, or regular expressions. Drag columns to change their order.
3. Click **Done** to close the column browser.
To sort the list of runs by any visible column:
1. Hover over the column name, then click its action `...` menu.
2. Click **Sort ascending** or **Sort descending**.
Pinned columns are shown on the right-hand side. To pin or unpin a column:
1. Hover over the column name, then click its action `...` menu.
2. Click **Pin column** or **Unpin column**.
By default, long run names are truncated in the middle for readability. To customize the truncation of run names:
1. Click the action `...` menu at the top of the list of runs.
2. Set **Run name cropping** to crop the end, middle, or beginning.
## Distributed training with grouping
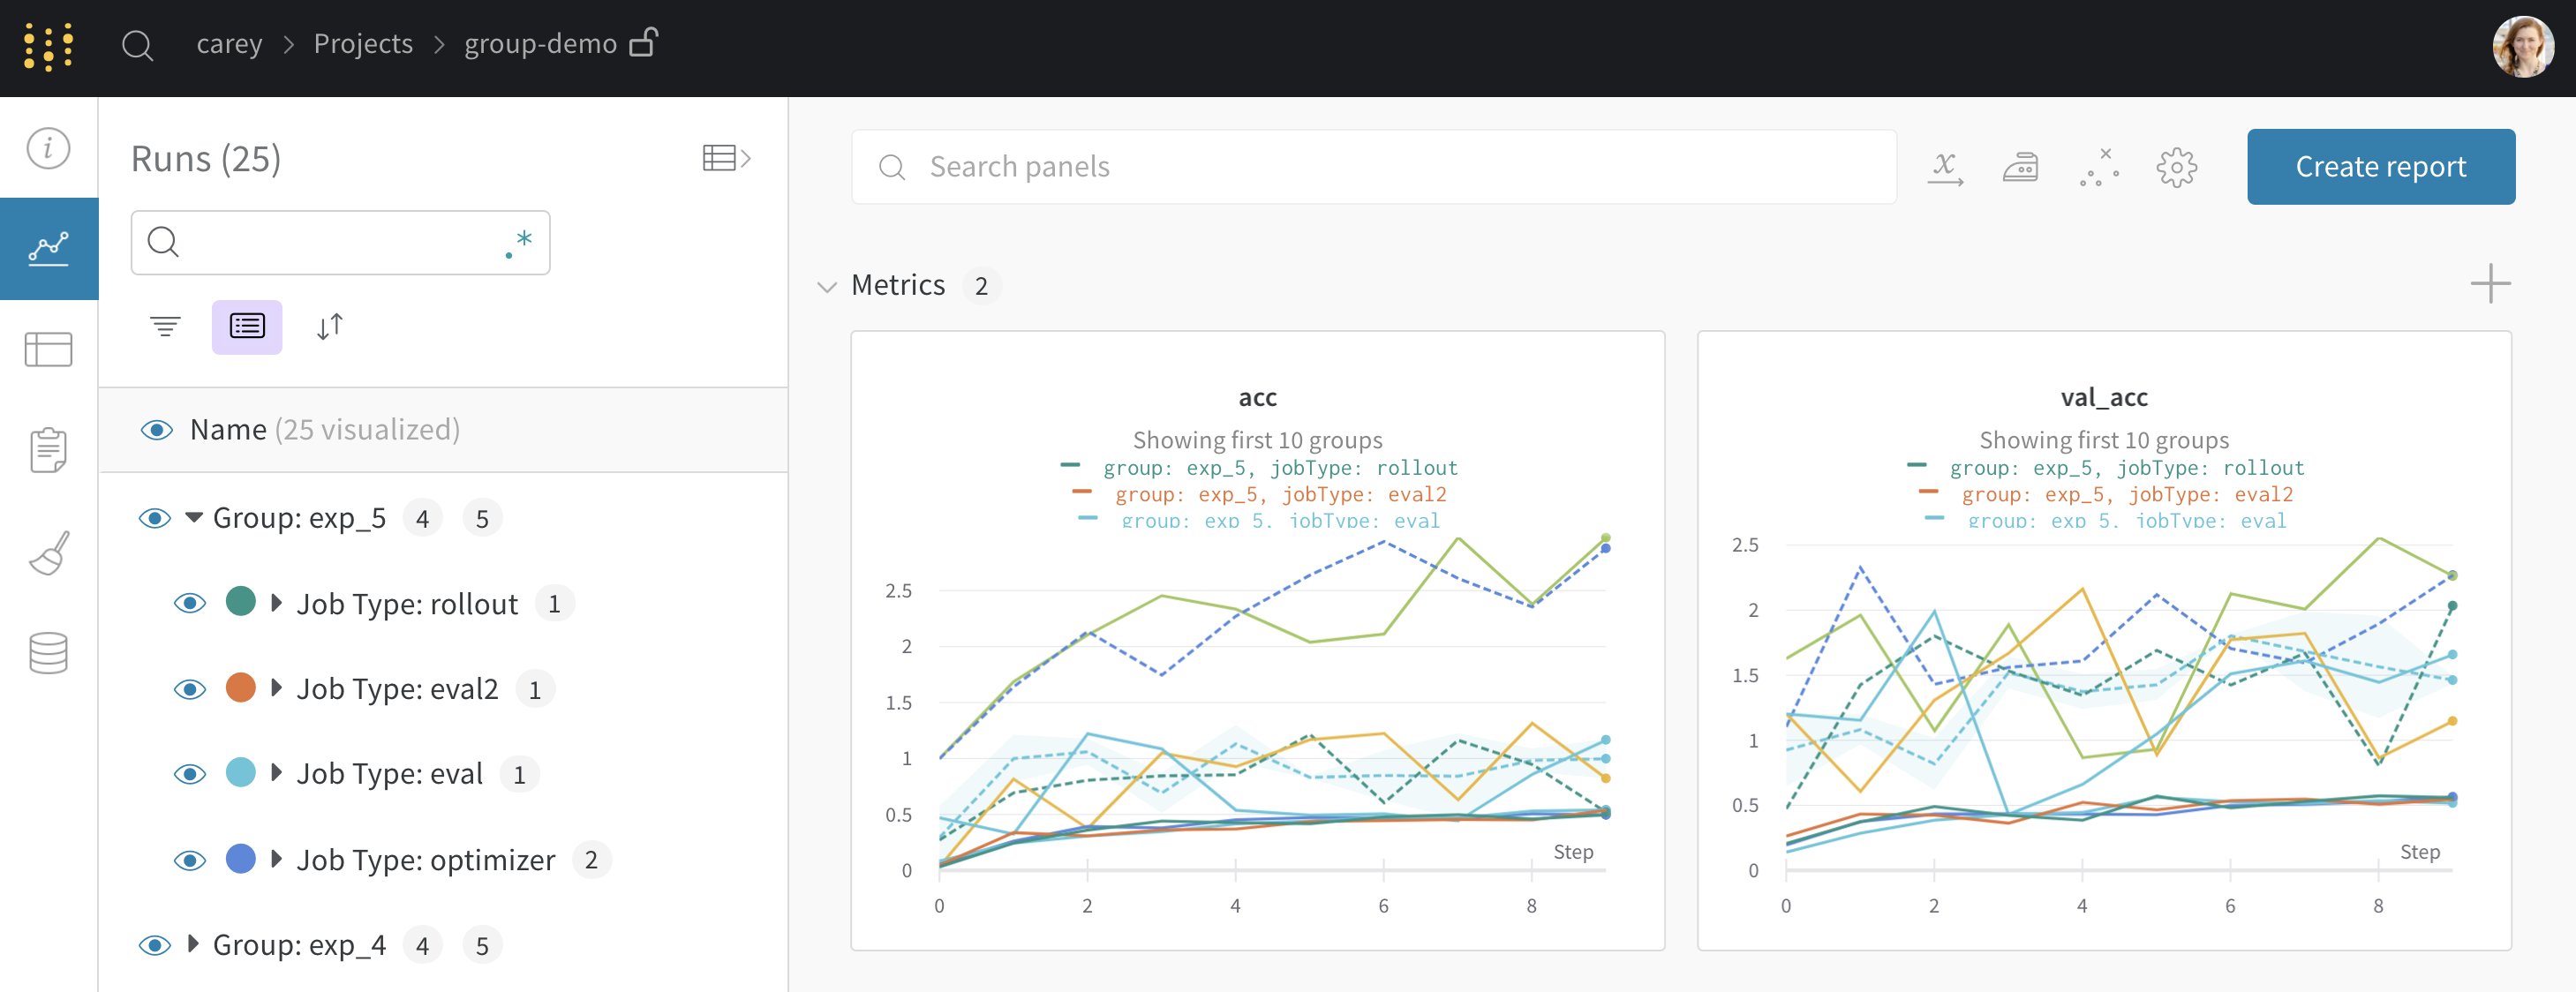
Suppose you set grouping in `wandb.init()`, we will group runs by default in the UI. You can toggle this on and off by clicking the **Group** button at the top of the table. Here's an [example project](https://wandb.ai/carey/group-demo?workspace=user-carey) generated from [sample code](https://wandb.me/grouping) where we set grouping. You can click on each "Group" row in the sidebar to get to a dedicated group page for that experiment.
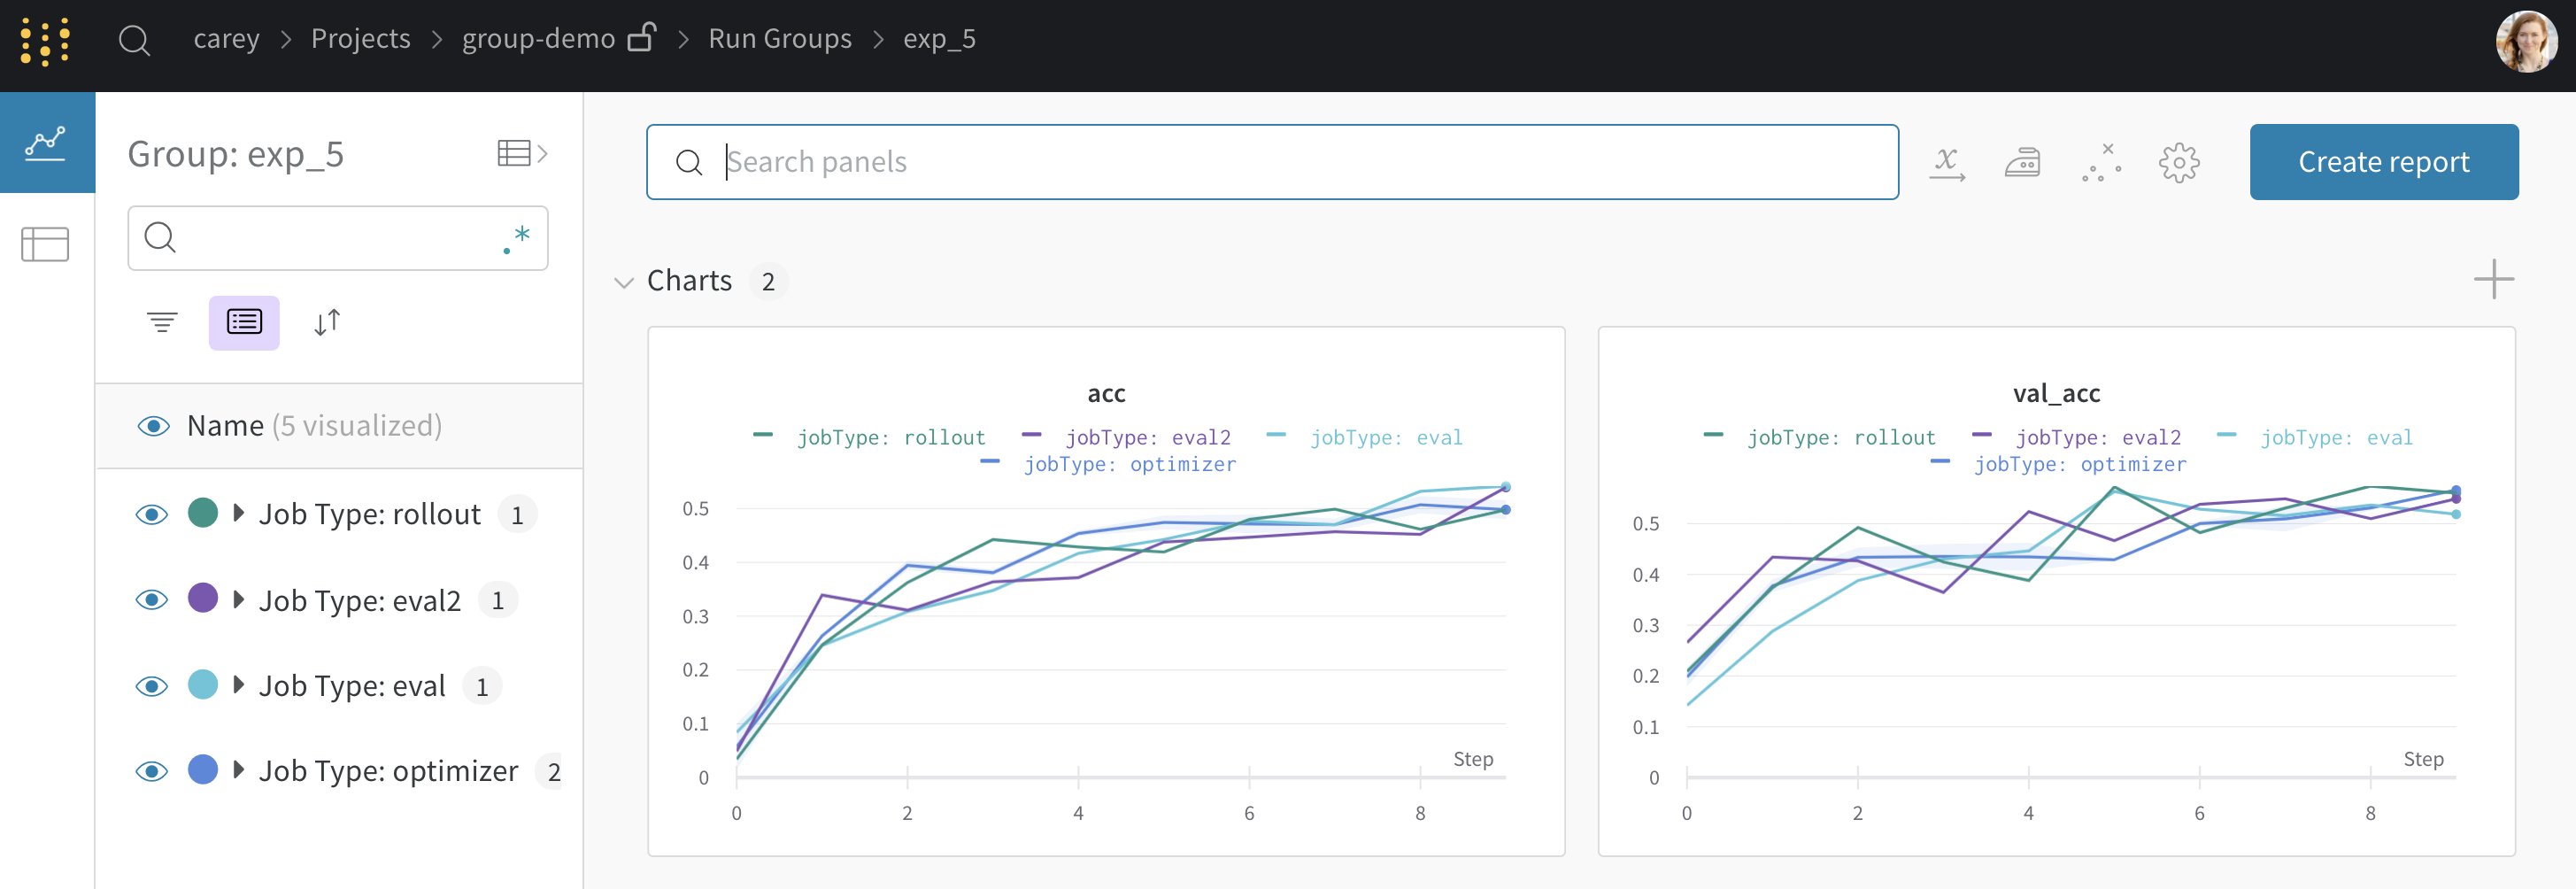
 From the project page above, you can click a **Group** in the left sidebar to get to a dedicated page like [this one](https://wandb.ai/carey/group-demo/groups/exp_5?workspace=user-carey):
 ## Grouping dynamically in the UI
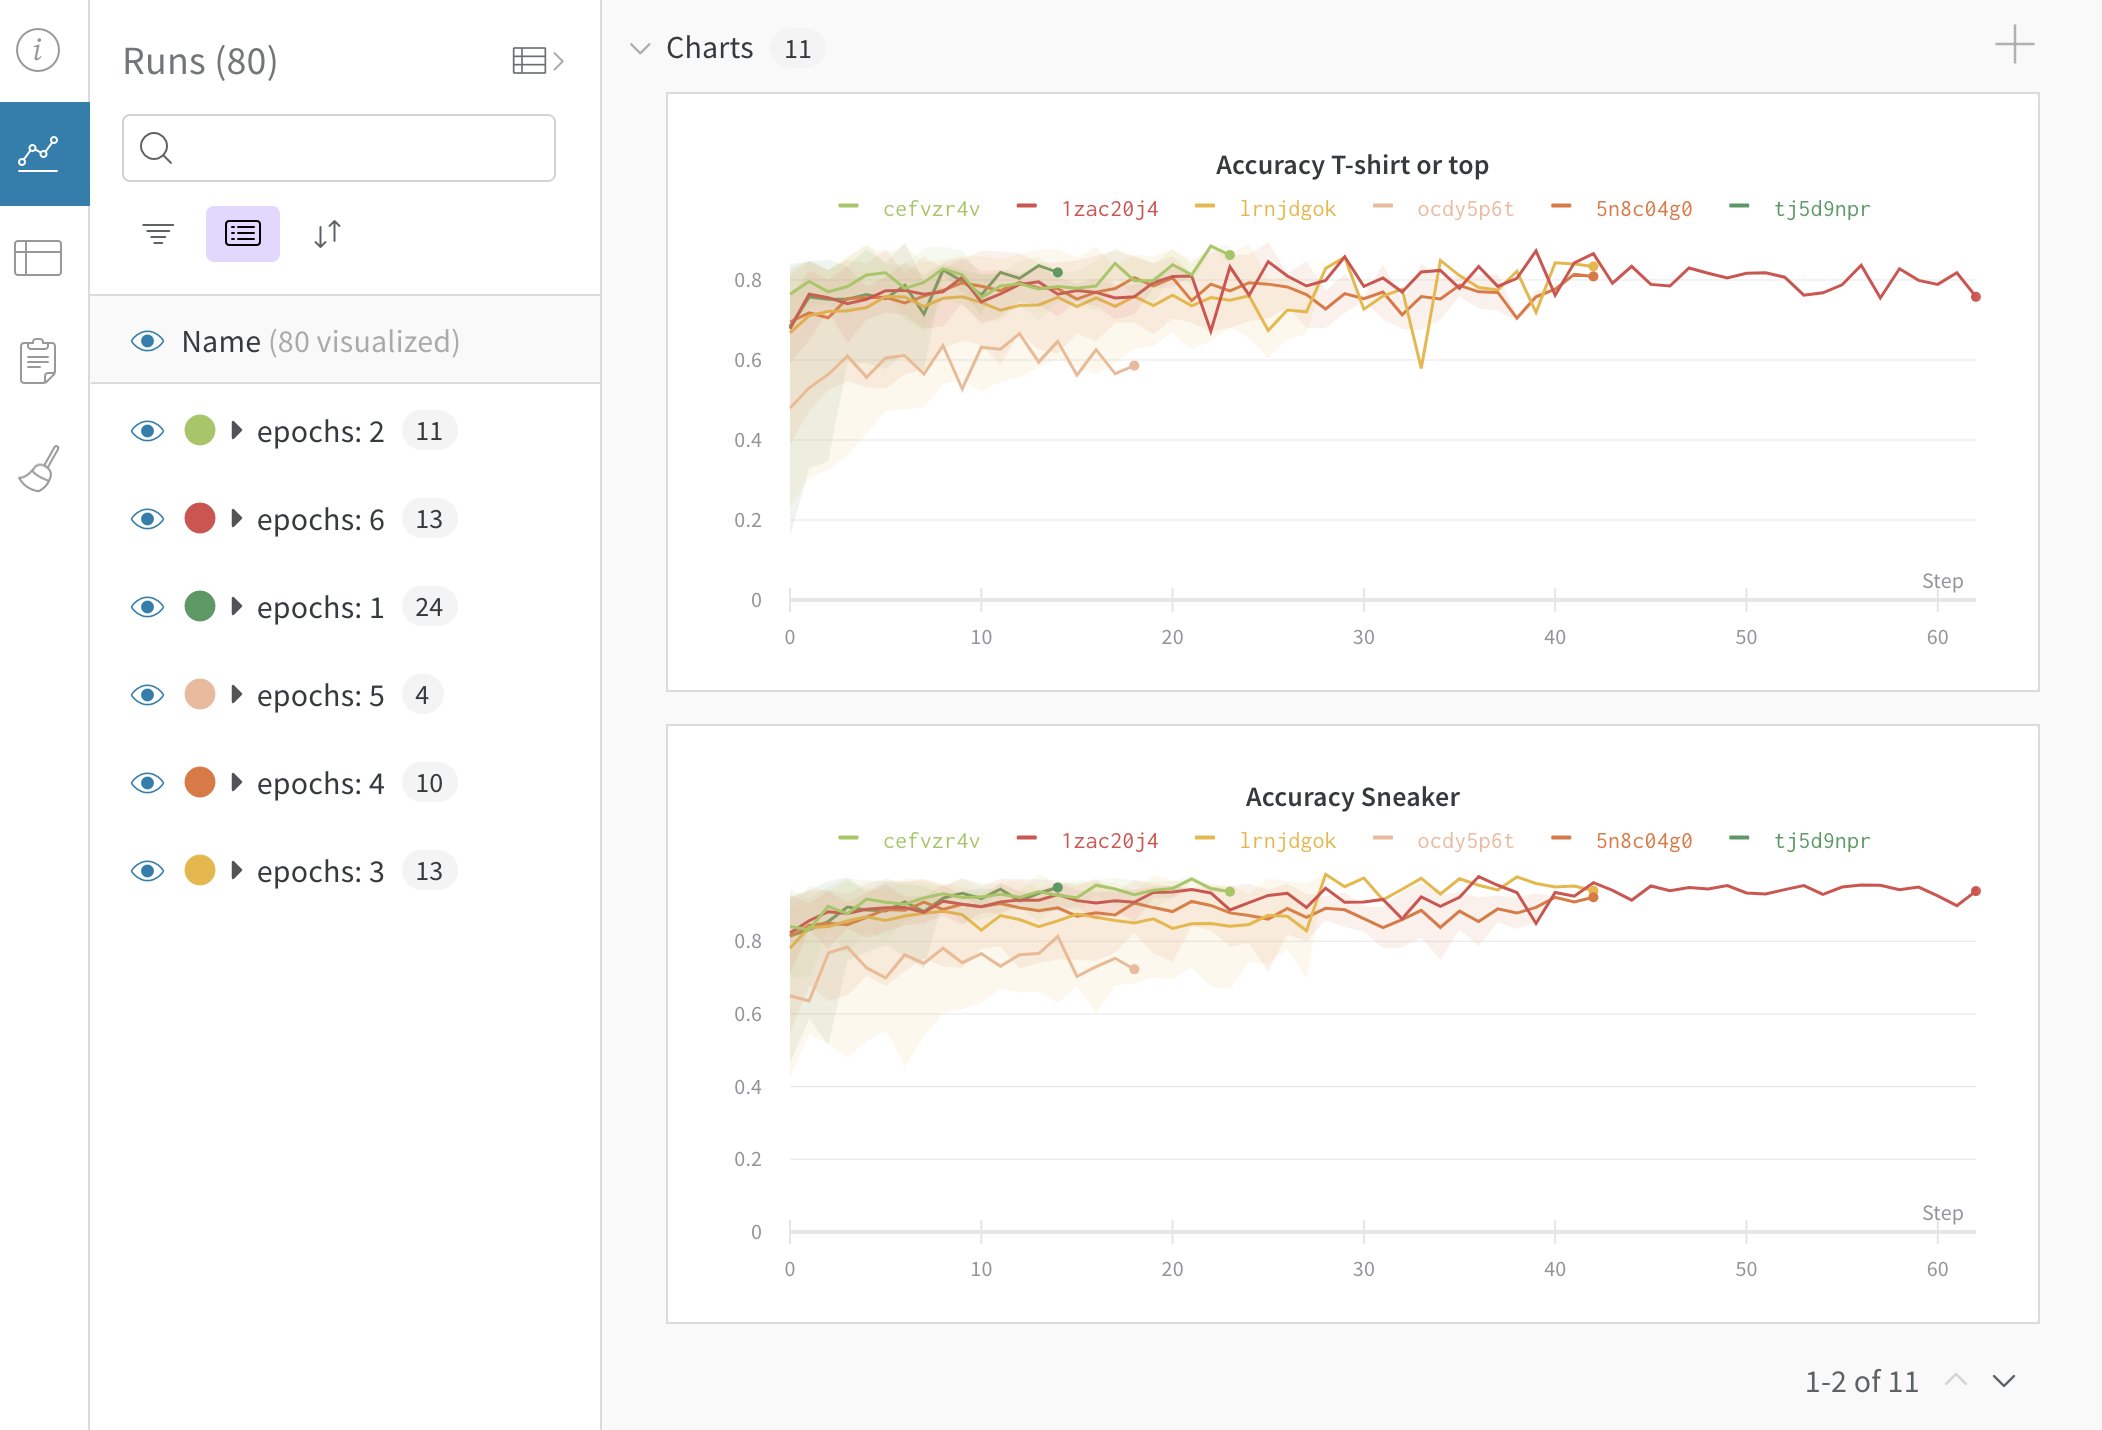
You can group runs by any column, for example by hyperparameter. Here's an example of what that looks like:
* **Sidebar**: Runs are grouped by the number of epochs.
* **Graphs**: Each line represents the group's mean, and the shading indicates the variance. This behavior can be changed in the graph settings.
## Grouping dynamically in the UI
You can group runs by any column, for example by hyperparameter. Here's an example of what that looks like:
* **Sidebar**: Runs are grouped by the number of epochs.
* **Graphs**: Each line represents the group's mean, and the shading indicates the variance. This behavior can be changed in the graph settings.
 ## Turn off grouping
Click the grouping button and clear group fields at any time, which returns the table and graphs to their ungrouped state.
## Turn off grouping
Click the grouping button and clear group fields at any time, which returns the table and graphs to their ungrouped state.
 ## Grouping graph settings
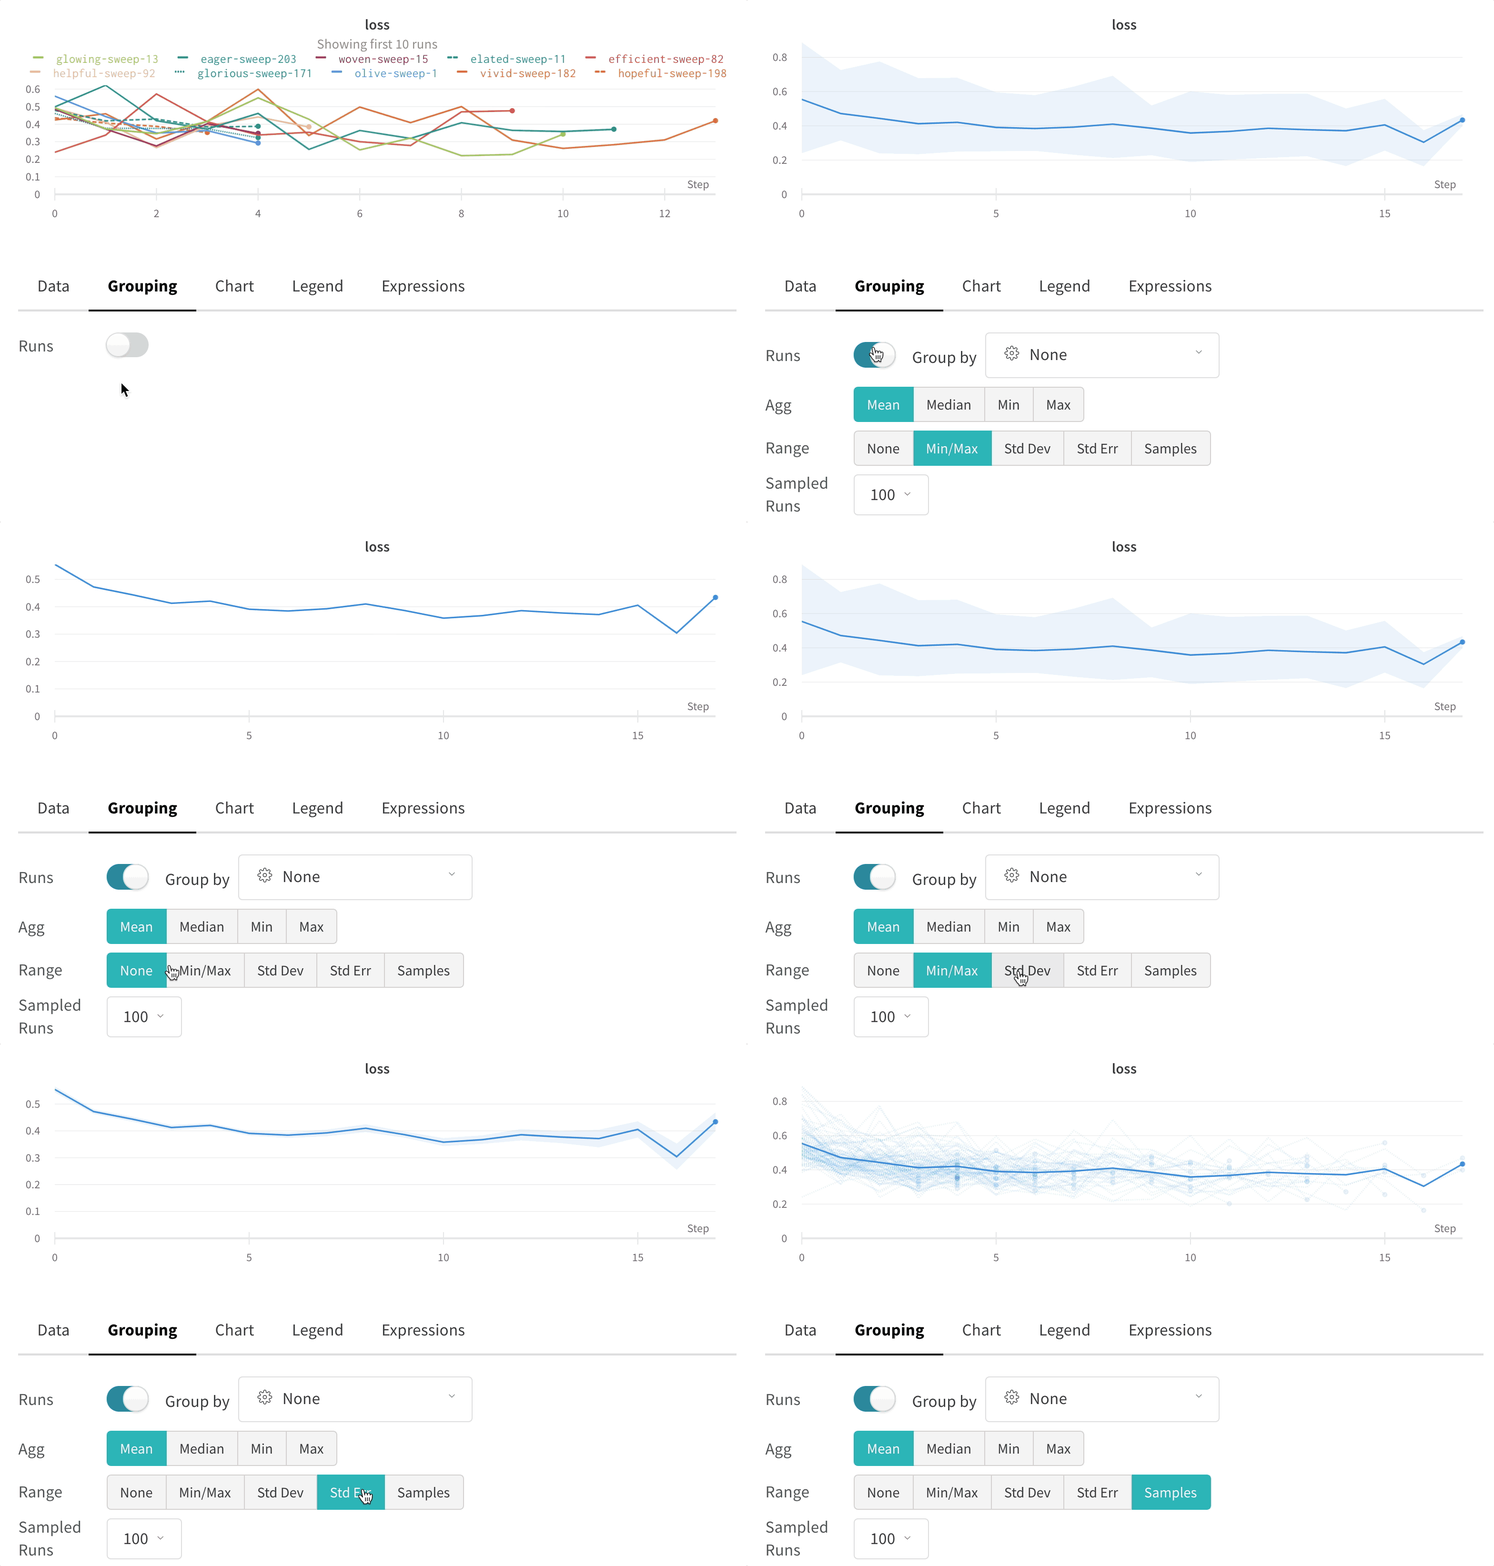
Click the edit button in the upper right corner of a graph and select the **Advanced** tab to change the line and shading. You can select the mean, minimum, or maximum value for the line in each group. For the shading, you can turn off shading, and show the min and max, the standard deviation, and the standard error.
## Grouping graph settings
Click the edit button in the upper right corner of a graph and select the **Advanced** tab to change the line and shading. You can select the mean, minimum, or maximum value for the line in each group. For the shading, you can turn off shading, and show the min and max, the standard deviation, and the standard error.