> ## Documentation Index
> Fetch the complete documentation index at: https://wb-21fd5541-feat-cli-docs-generator.mintlify.site/llms.txt
> Use this file to discover all available pages before exploring further.
# Use trace plots
> Visualize and debug trace-level metrics with interactive charts in Weave, exploring latency, cost, and token usage patterns through default and custom plots to optimize LLM application performance.
The *trace plots* tool in W\&B Weave allows you to explore, visualize, and debug trace-level metrics (e.g. latency, cost, tokens) using interactive charts. You can use the default trace plots or create your own via the custom trace plot builder.
 ## Get started
1. Navigate to your project's **Traces** page.
2. (Optional) Select **Filter** to filter selected traces (e.g. by datetime or operation).
3. In the upper right hand corner of the **Traces** view, click the **Show Metrics** icon to open the trace plots side pane.
## Get started
1. Navigate to your project's **Traces** page.
2. (Optional) Select **Filter** to filter selected traces (e.g. by datetime or operation).
3. In the upper right hand corner of the **Traces** view, click the **Show Metrics** icon to open the trace plots side pane.
 From here, you can:
* View the [default trace plots](#default-trace-plots).
* Create a [custom trace plots](#create-a-custom-trace-plot).
4. Charts update dynamically based on your trace filters and selections.
## Default trace plots
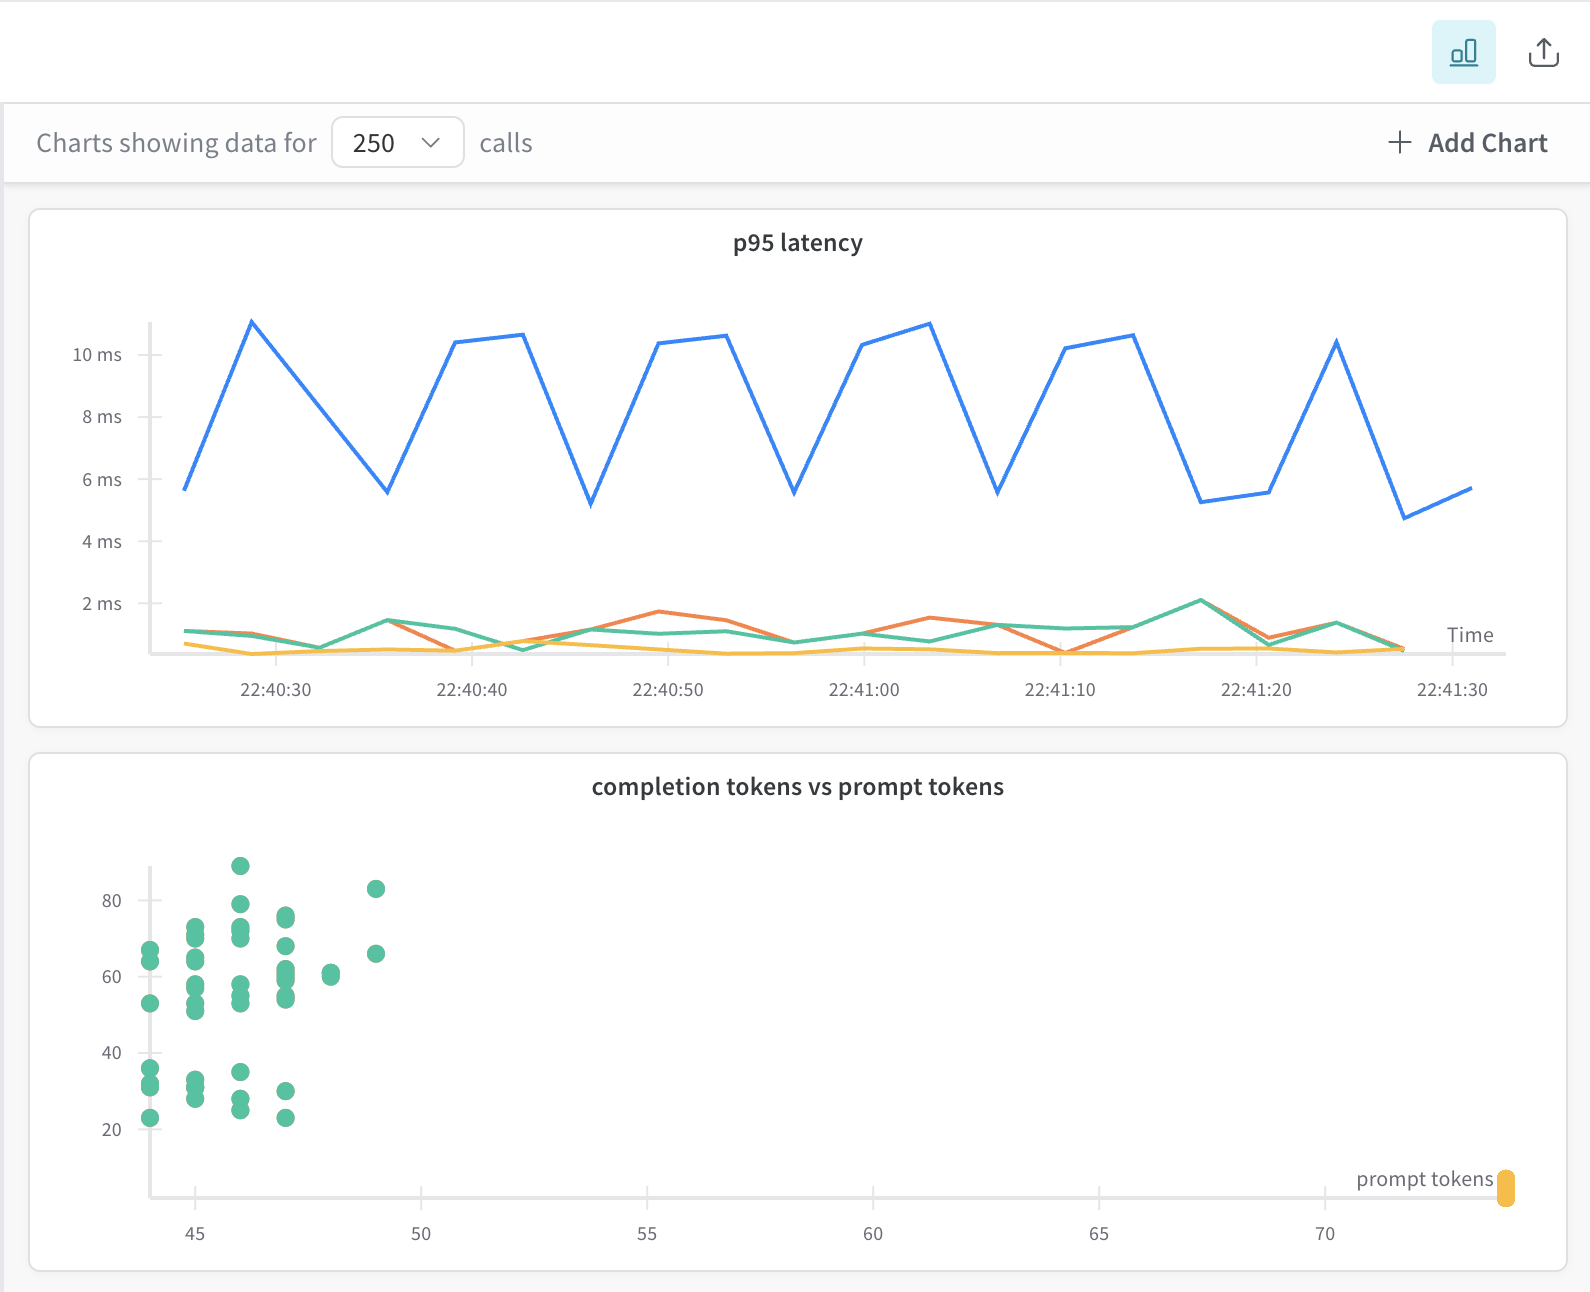
When you first open the trace plots panel, Weave auto-generates a few trace plots based on your available project trace data:
* Bar chart (cost or latency grouped over time bins)
* Line chart (latency over time)
* Scatter plot (e.g. prompt tokens vs. completion tokens)
Each trace plot is interactive:
* Hover for tooltips
* Drag to zoom
* Double-click to reset
* Click points in scatter plots to open a specific trace
## Create a custom trace plot
You can also create custom trace plot. To create a custom trace plot, do the following:
1. From the trace plots side pane, click **➕ Add Chart** .
From here, you can:
* View the [default trace plots](#default-trace-plots).
* Create a [custom trace plots](#create-a-custom-trace-plot).
4. Charts update dynamically based on your trace filters and selections.
## Default trace plots
When you first open the trace plots panel, Weave auto-generates a few trace plots based on your available project trace data:
* Bar chart (cost or latency grouped over time bins)
* Line chart (latency over time)
* Scatter plot (e.g. prompt tokens vs. completion tokens)
Each trace plot is interactive:
* Hover for tooltips
* Drag to zoom
* Double-click to reset
* Click points in scatter plots to open a specific trace
## Create a custom trace plot
You can also create custom trace plot. To create a custom trace plot, do the following:
1. From the trace plots side pane, click **➕ Add Chart** .
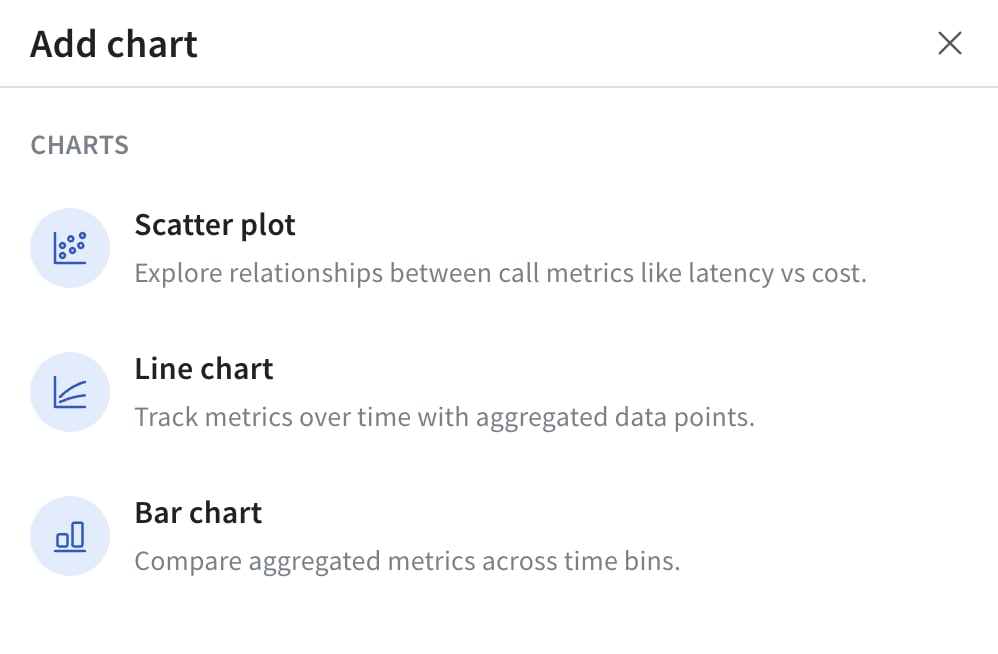
 2. In the pop-up, select one of the available trace plot types:
 3. For the selected trace plot type, configure your trace plot. For information on configuration options by trace plot type, see [Trace plot settings by plot type](#trace-plot-settings-by-plot-type).
4. Click **Save chart** to save your chart.
### Trace plot settings by plot type
When adding or editing a custom trace plot, the available configuration options vary slightly depending on the selected trace plot type. The table provides a breakdown of the configurable options.
| Setting | Scatter Plot | Line Chart | Bar Chart |
| ----------- | ------------ | -------------------- | -------------------- |
| Y-axis | ✅ Required | ✅ Required | ✅ Required |
| X-axis | ✅ Selectable | Fixed (`started at`) | Fixed (`started at`) |
| Grouping | ✅ Optional | ✅ Optional | ✅ Optional |
| Binning | ❌ Not used | ✅ Used | ✅ Used |
| Aggregation | ❌ Not used | ✅ Used | ✅ Used |
3. For the selected trace plot type, configure your trace plot. For information on configuration options by trace plot type, see [Trace plot settings by plot type](#trace-plot-settings-by-plot-type).
4. Click **Save chart** to save your chart.
### Trace plot settings by plot type
When adding or editing a custom trace plot, the available configuration options vary slightly depending on the selected trace plot type. The table provides a breakdown of the configurable options.
| Setting | Scatter Plot | Line Chart | Bar Chart |
| ----------- | ------------ | -------------------- | -------------------- |
| Y-axis | ✅ Required | ✅ Required | ✅ Required |
| X-axis | ✅ Selectable | Fixed (`started at`) | Fixed (`started at`) |
| Grouping | ✅ Optional | ✅ Optional | ✅ Optional |
| Binning | ❌ Not used | ✅ Used | ✅ Used |
| Aggregation | ❌ Not used | ✅ Used | ✅ Used |