

 Platform
 W&B Models
 W&B Weave
 W&B Inference
 W&B Training
 Release Notes
Tracing
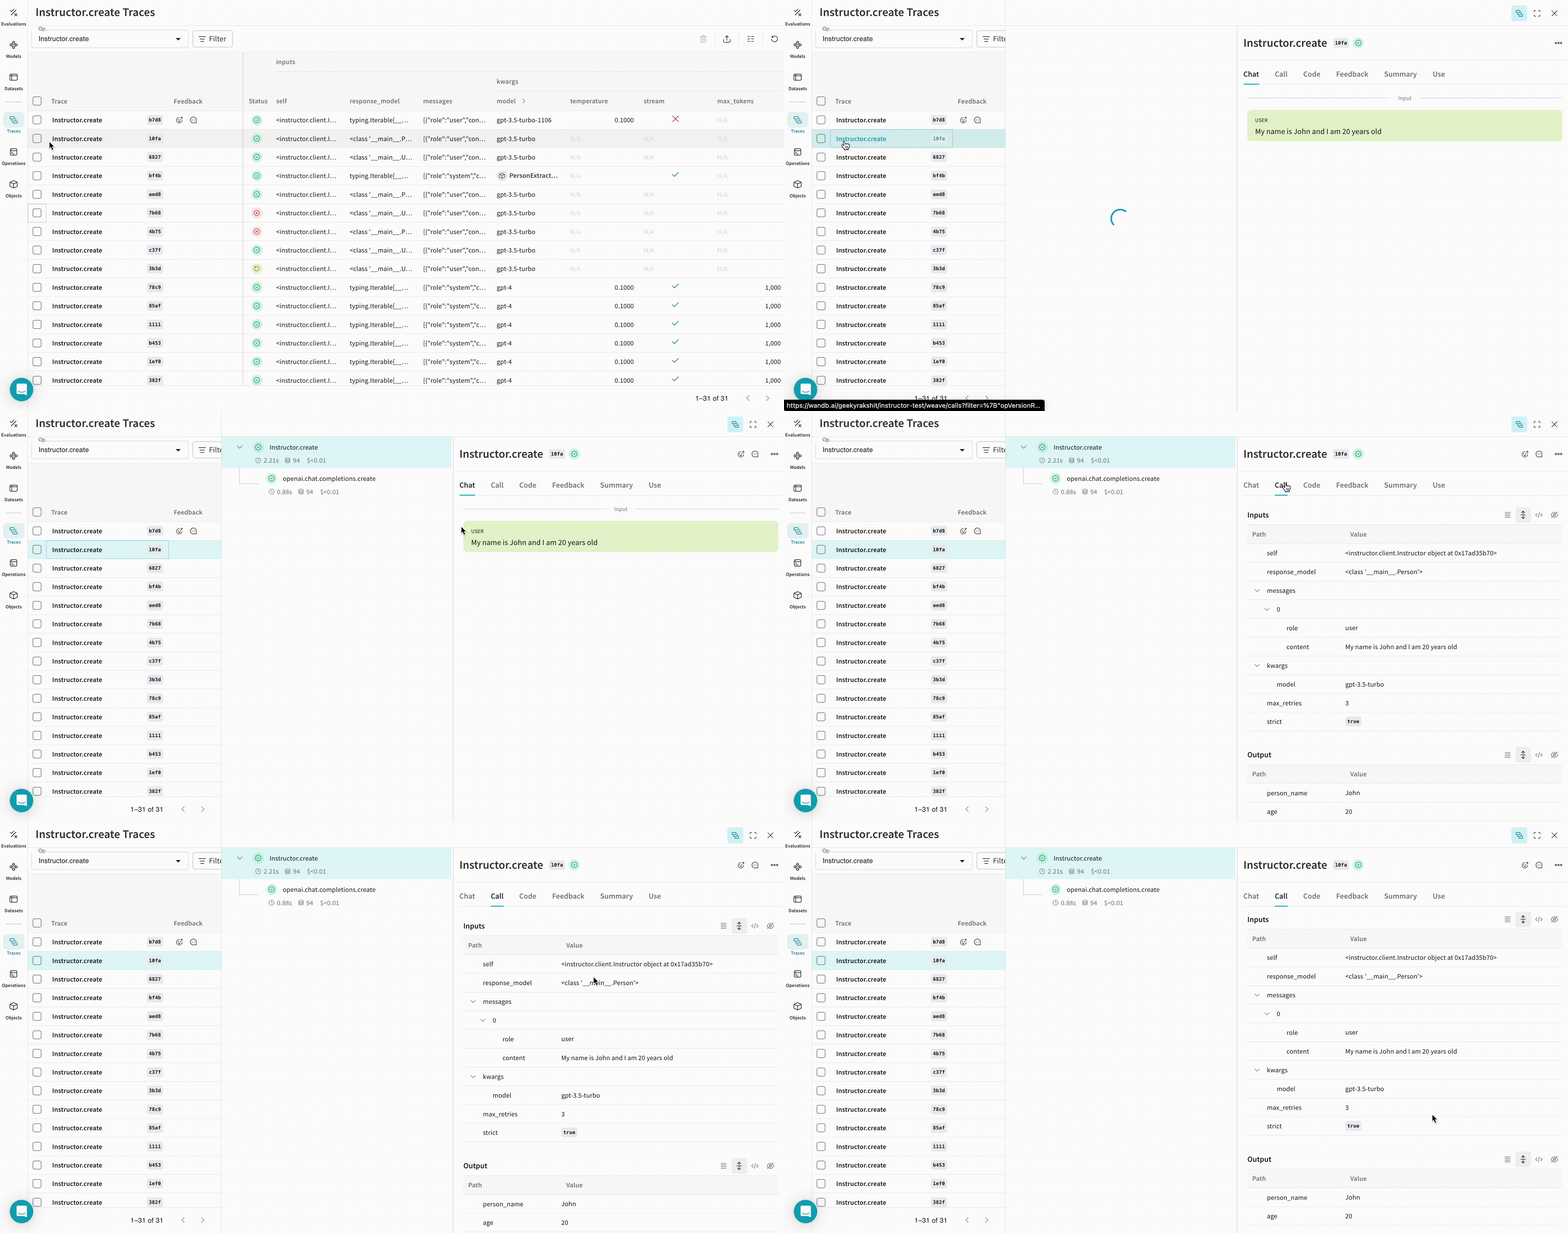
It’s important to store traces of language model applications in a central location, both during development and in production. These traces can be useful for debugging, and as a dataset that will help you improve your application. Weave will automatically capture traces for Instructor. To start tracking, callingweave.init(project_name="<YOUR-WANDB-PROJECT-NAME>") and use the library as normal.
 |
|---|
| Weave will now track and log all LLM calls made using Instructor. You can view the traces in the Weave web interface. |
Track your own ops
Wrapping a function with@weave.op starts capturing inputs, outputs and app logic so you can debug how data flows through your app. You can deeply nest ops and build a tree of functions that you want to track. This also starts automatically versioning code as you experiment to capture ad-hoc details that haven’t been committed to git.
Simply create a function decorated with @weave.op.
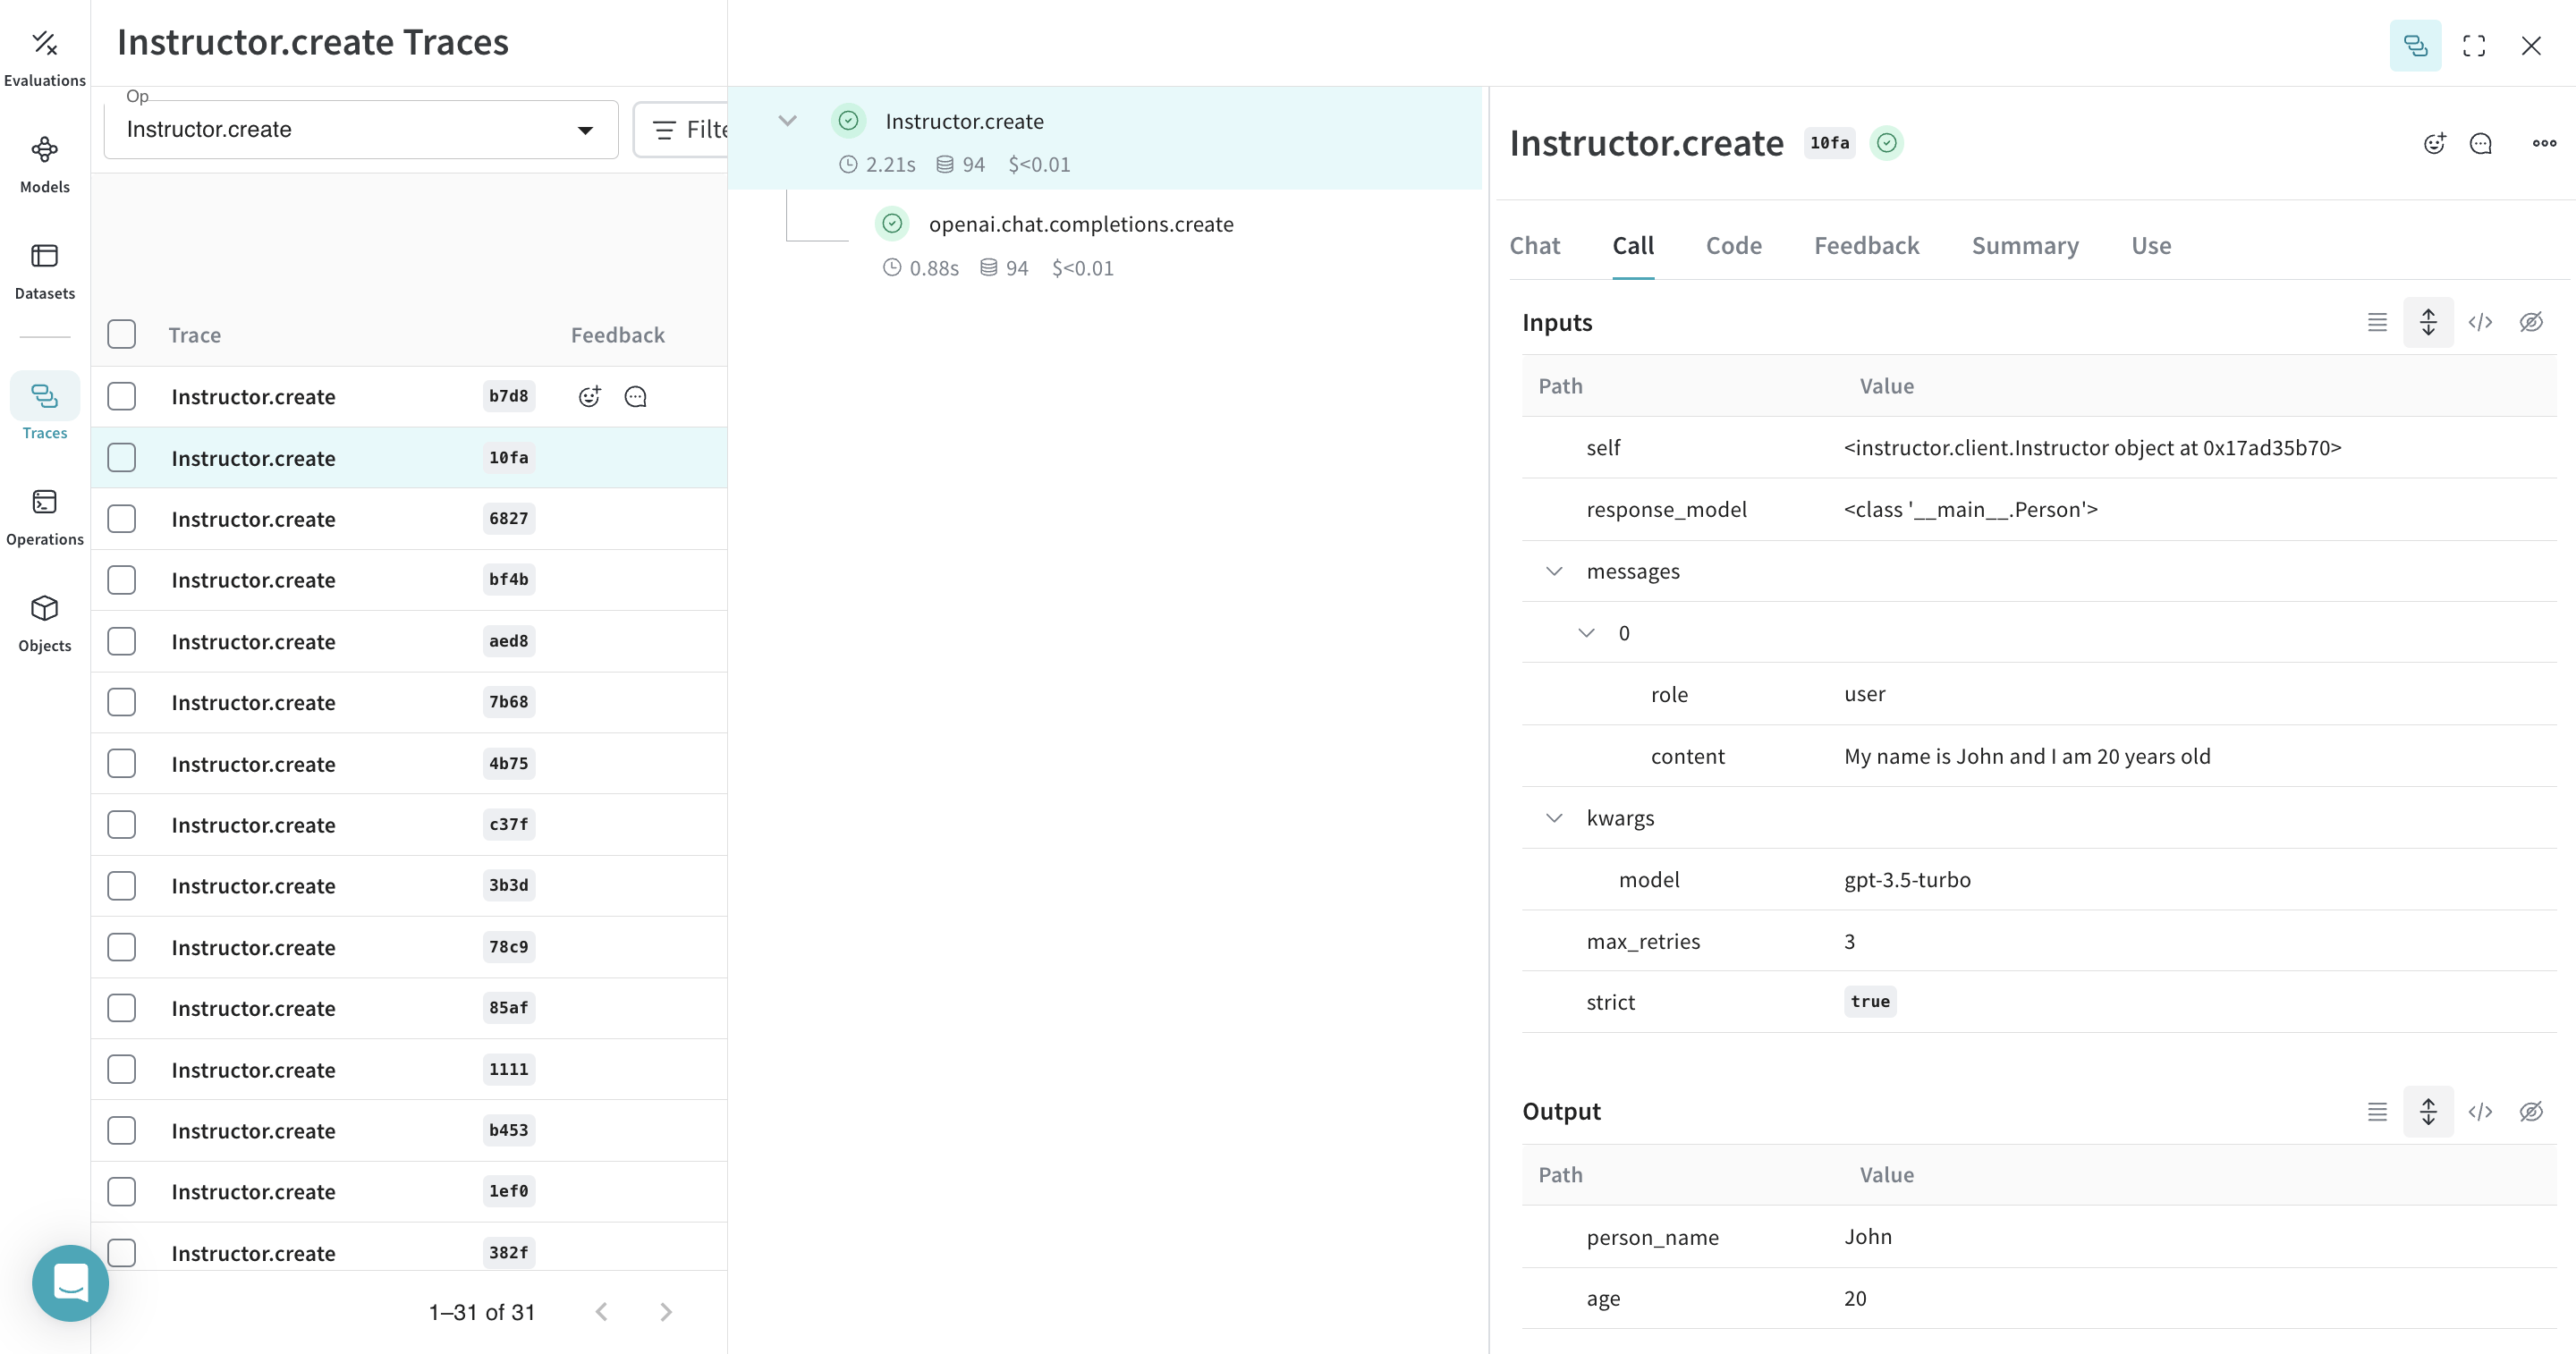
In the example below, we have the function extract_person which is the metric function wrapped with @weave.op. This helps us see how intermediate steps, such as OpenAI chat completion call.
 |
|---|
Decorating the extract_person function with @weave.op traces its inputs, outputs, and all internal LM calls made inside the function. Weave also automatically tracks and versions the structured objects generated by Instructor. |
Create a Model for easier experimentation
Organizing experimentation is difficult when there are many moving pieces. By using the Model class, you can capture and organize the experimental details of your app like your system prompt or the model you’re using. This helps organize and compare different iterations of your app.
In addition to versioning code and capturing inputs/outputs, Models capture structured parameters that control your application’s behavior, making it easy to find what parameters worked best. You can also use Weave Models with serve (see below), and Evaluations.
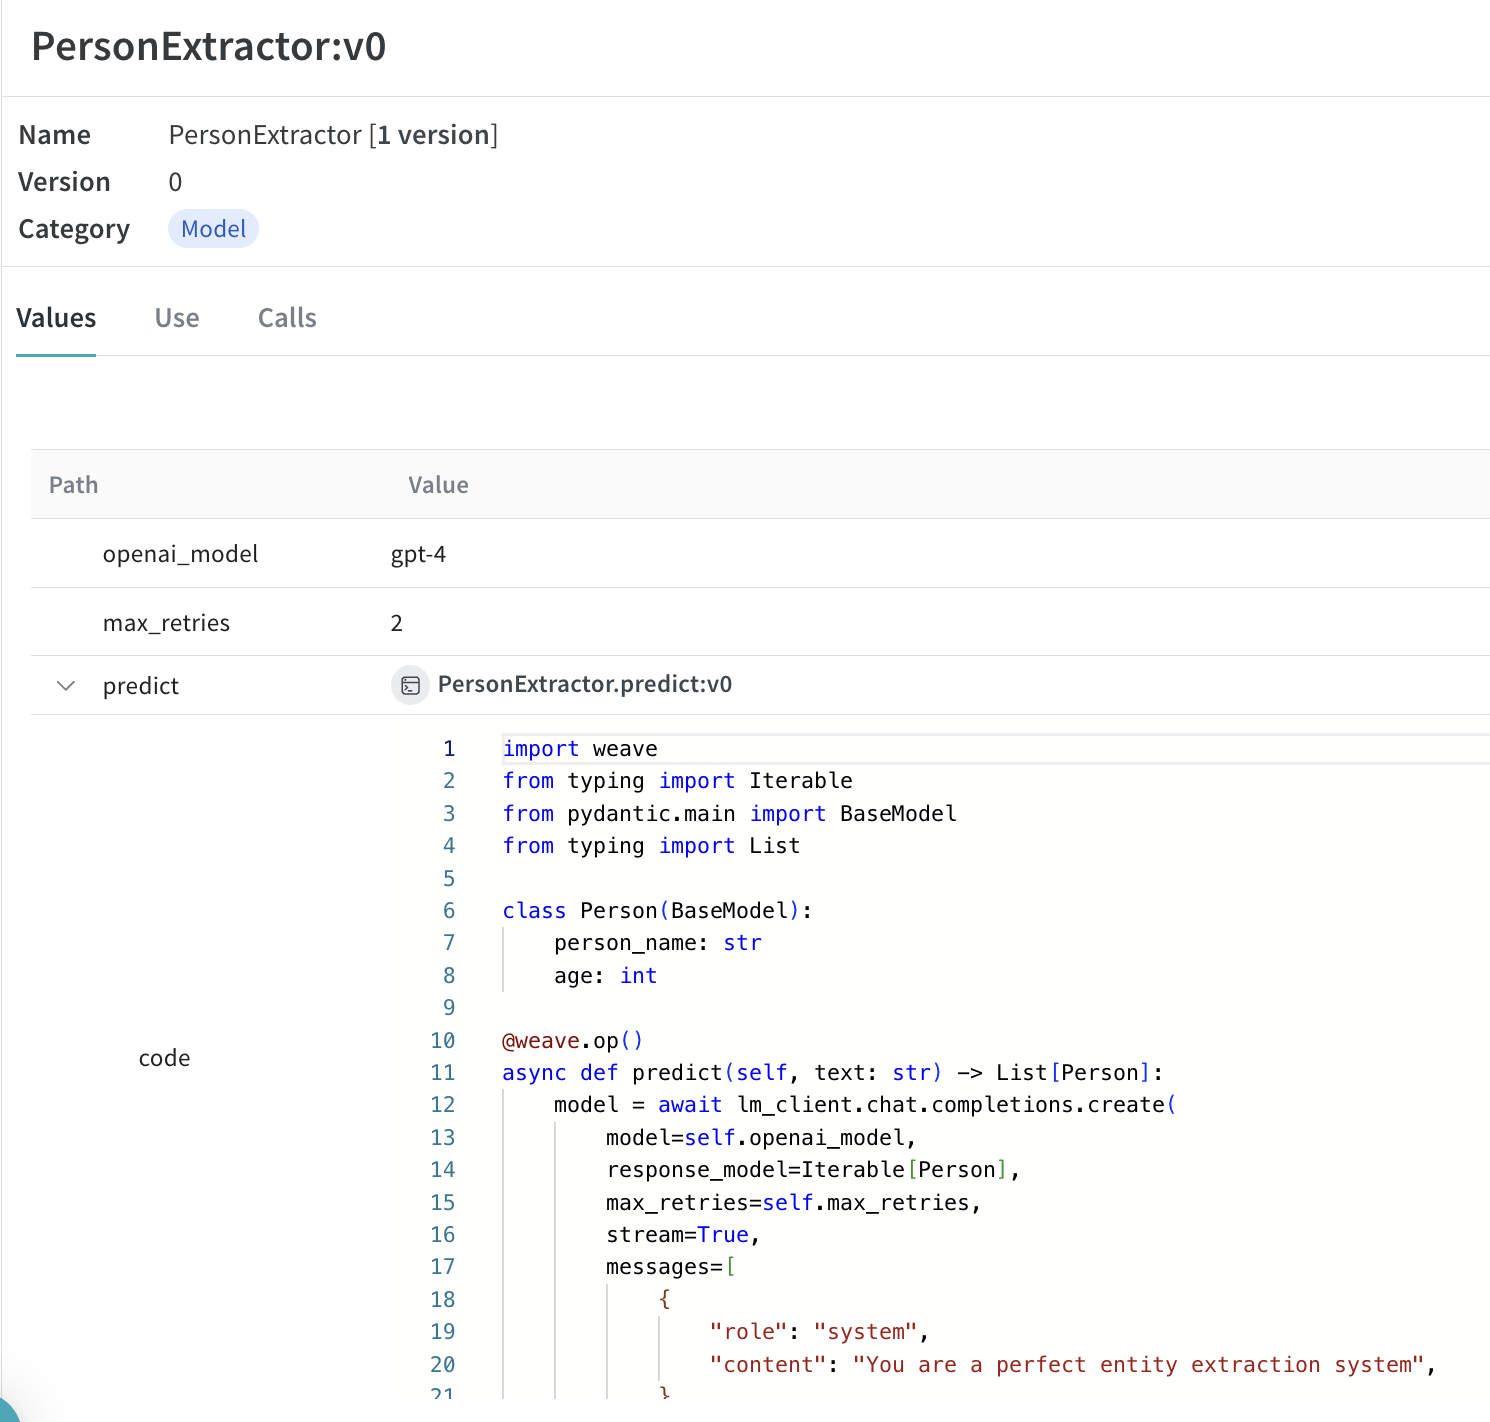
In the example below, you can experiment with PersonExtractor. Every time you change one of these, you’ll get a new version of PersonExtractor.
 |
|---|
Tracing and versioning your calls using a Model |
Serving a Weave Model
Given a weave reference aweave.Model object, you can spin up a fastapi server and serve it.
 |
|---|
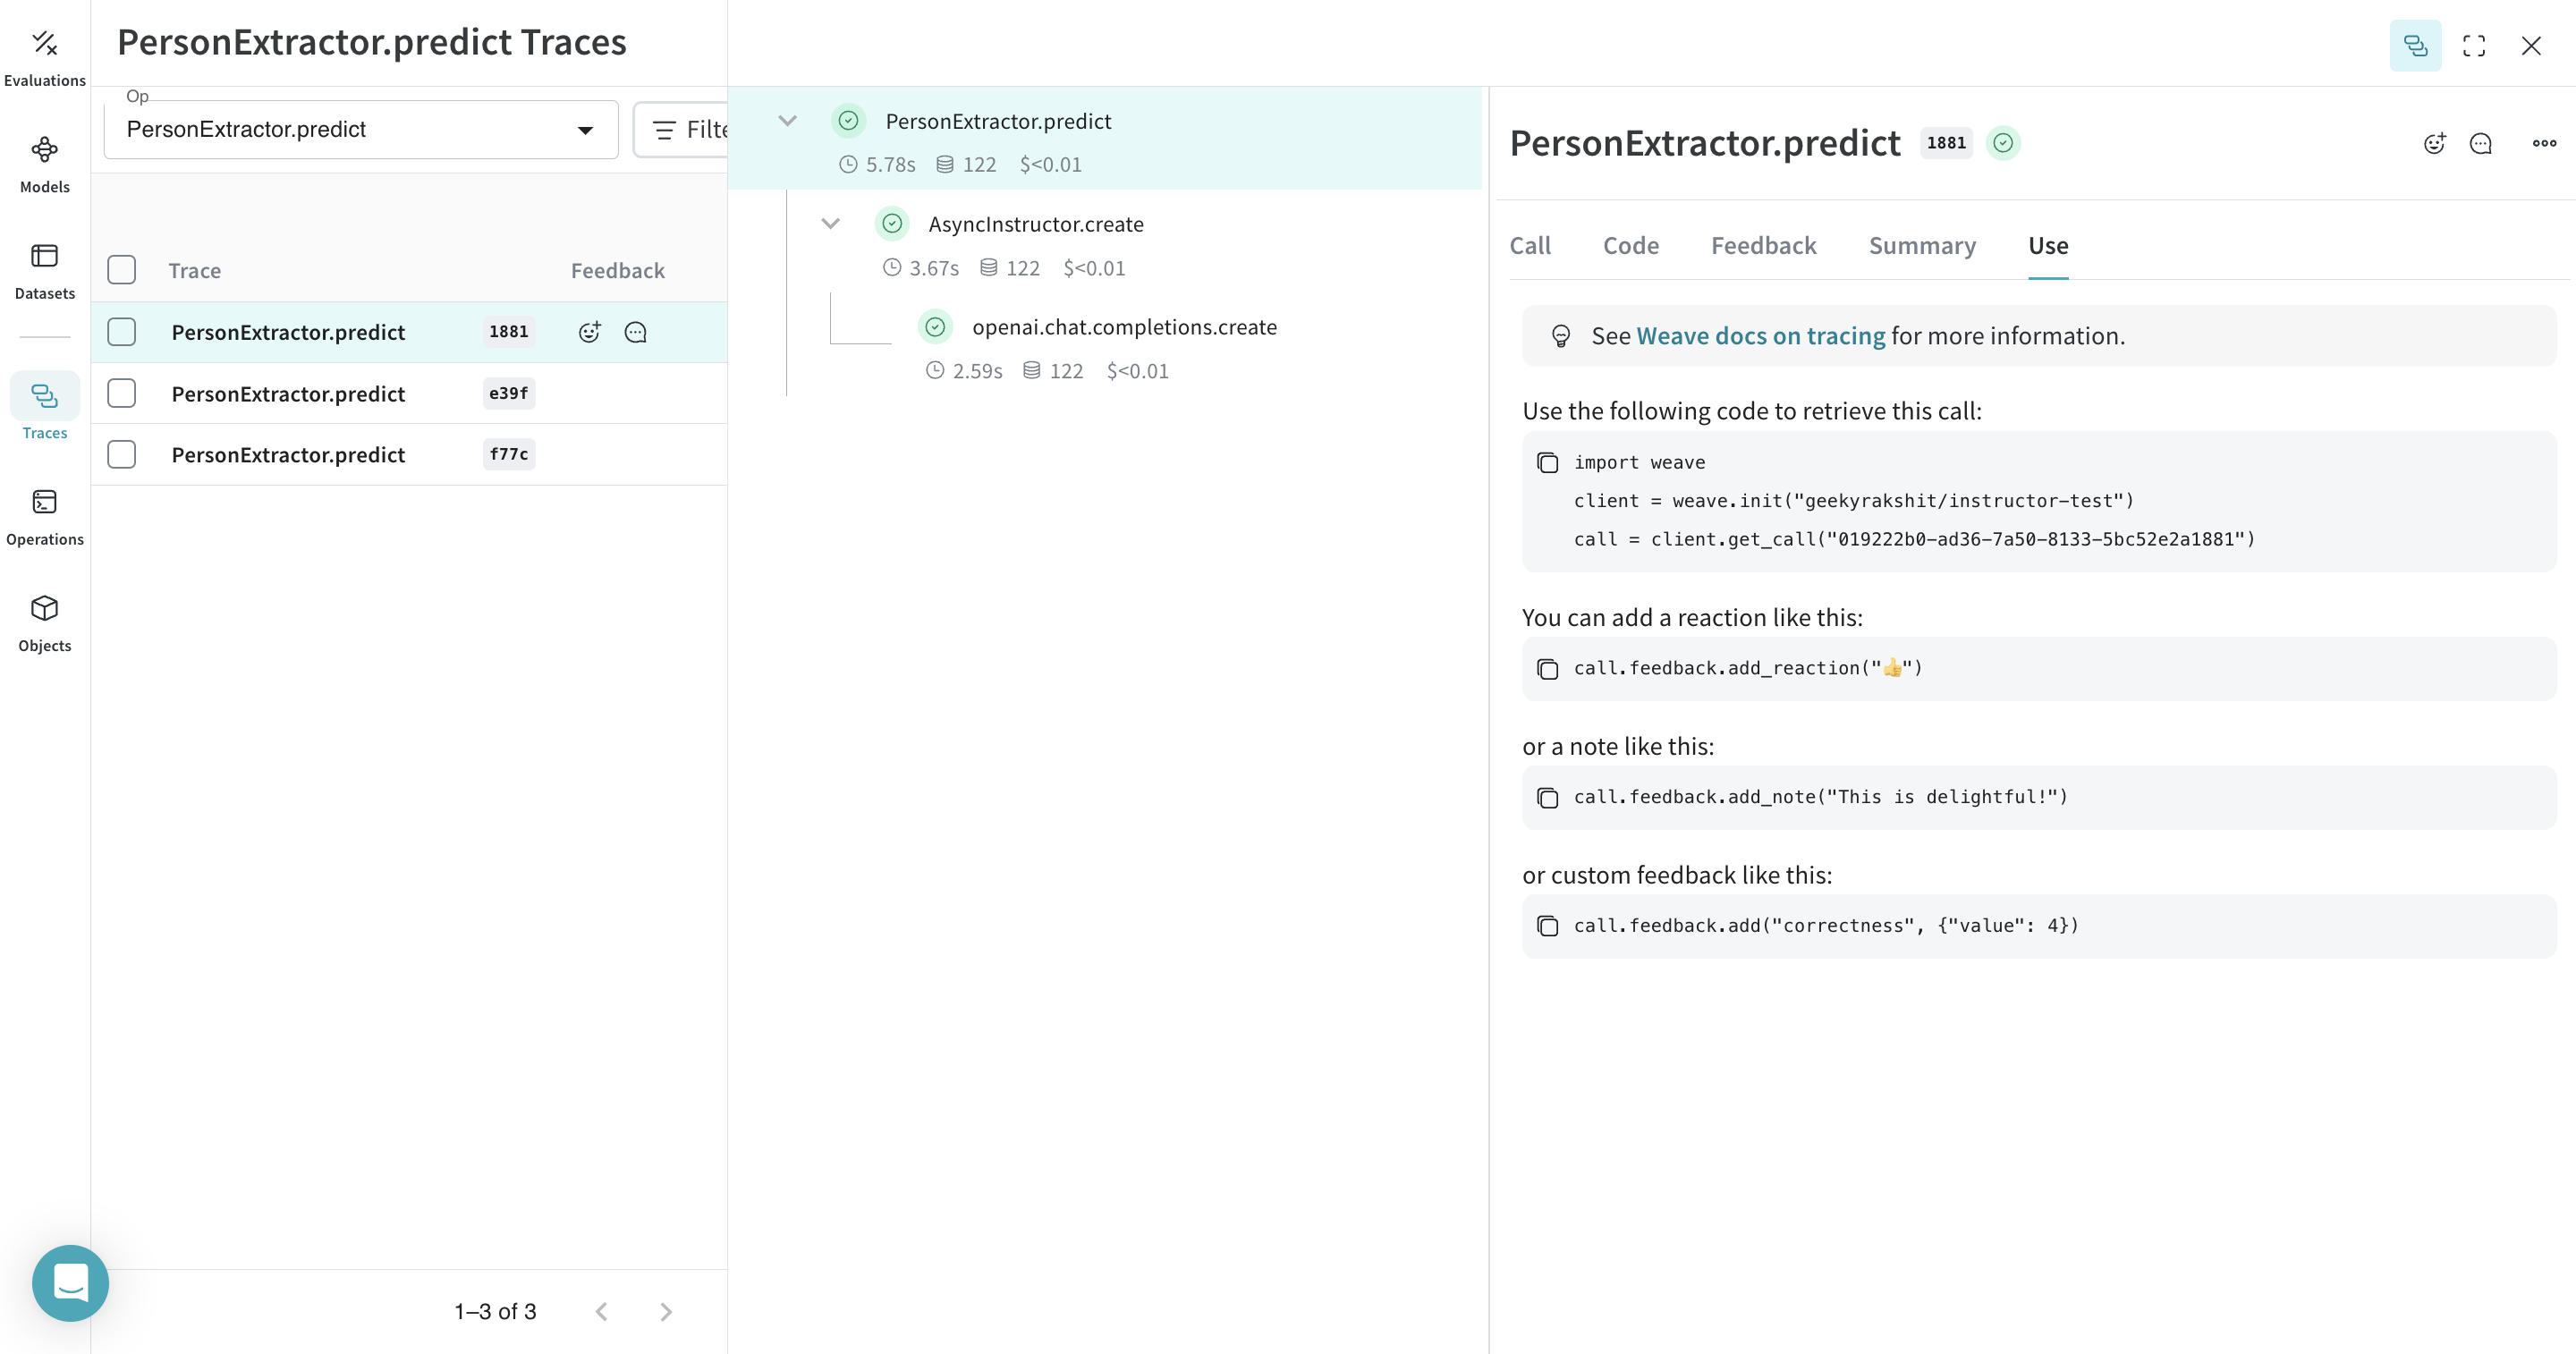
You can find the weave reference of any weave.Model by navigating to the model and copying it from the UI. |